SEO analysis of the store, or how to check SEO results in online stores
Probably every online store owner who uses SEO agencies or freelancers has heard from them that SEO is a marathon, not a sprint. This is true, of course, but how then do we check if our marathon runner is running at the right pace and direction? In this article, we will look at simple methods to evaluate SEO efforts and the results they bring. .
Store SEO analysis in Google Analytics
.
Analyzing the results of our store’s SEO efforts is best started in Google Analytics-a free tool that every website owner should use. It provides information on how users get to our site and what interactions they have with it. .
In the following article, I will rely on the current version of Google Analytics 4, which became the current standard as of July 1, 2023.
To see what results an investment in SEO efforts brings to a store, we will analyze in this article:.
- How many users come from organic results? .- How do organic users behave on the site and do they generate conversions? .- How does revenue generated by organic users compare to other channels?
Check the amount of organic traffic
.
Positioning involves increasing the visibility of a website in the search results of online search enginessuch as Google and Bing. All this is done in order to get a user from them to enter the site and make a widespread conversion on it.
Such a user is called an organic user, because he or she came to our site without clicking on paid ads. .
An effectively implemented SEO strategy should get our online store visited by more and more users, and thus our organic traffic will keep growing. .
Therefore, we can simplistically assume that organic traffic is the key to the development of a store - without it, the store does not earn, and SEO efforts turn out to be money spent in the proverbial mud. .
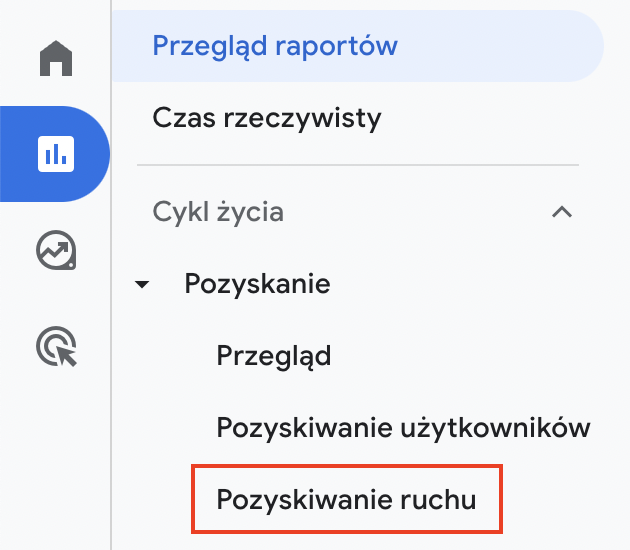
The amount of organic traffic in Google Analytics can be checked in various ways. But the easiest way is to go to the Lifecycle -> Acquisition -> Traffic Acquisition tab. .
 .
.
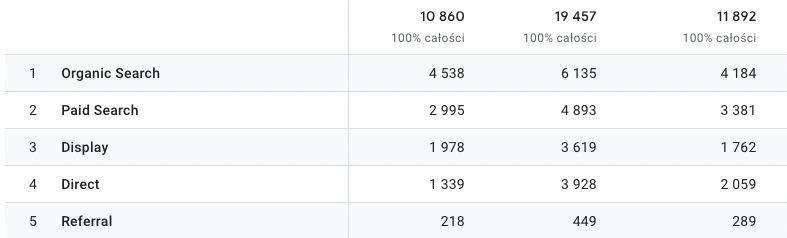
In the table there, we will see the sources from which our online store is currently getting traffic. The group we are interested in is Organic Search. We can verify how many users come from the search results, and how this source is performing compared to the others.
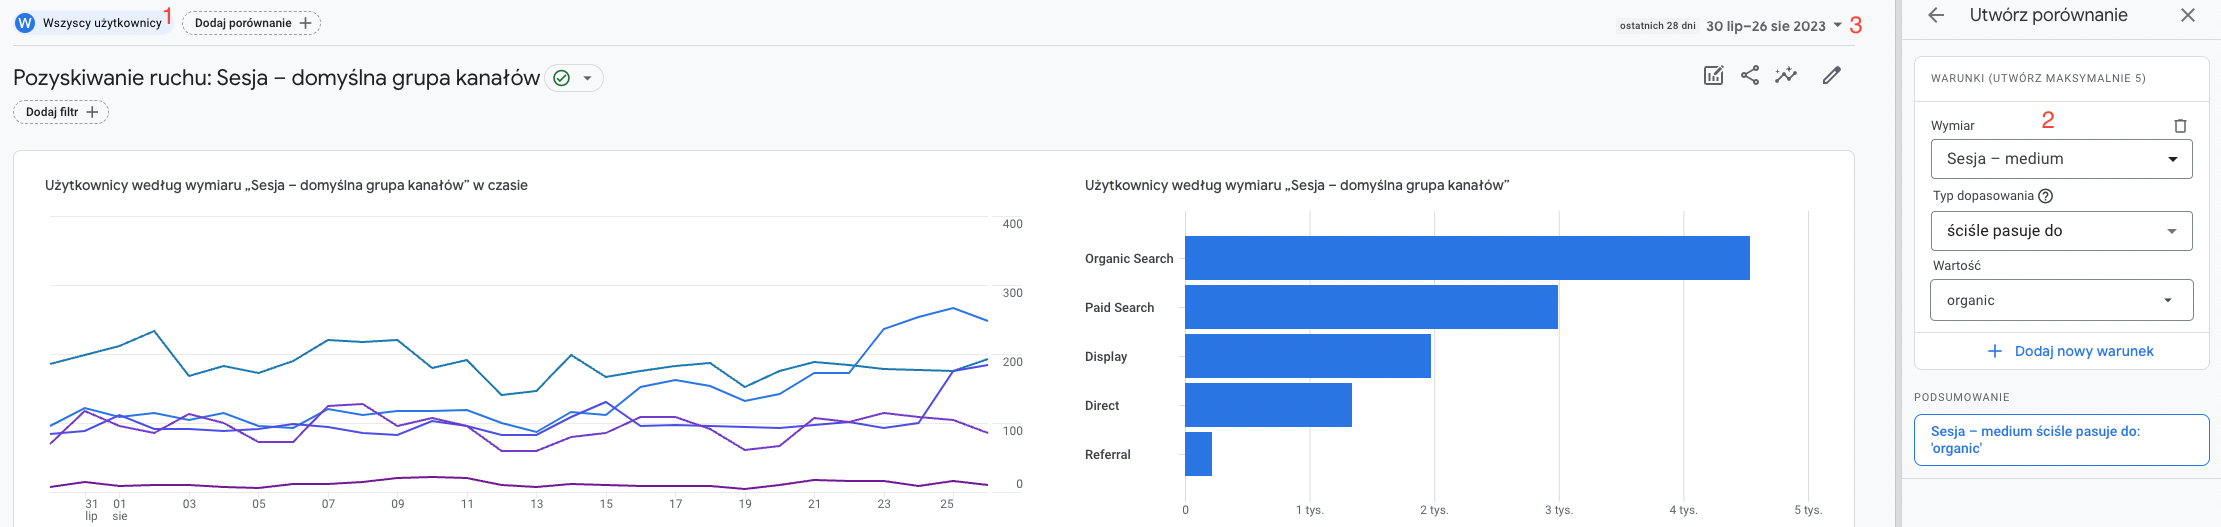
It’s also worth checking how the number of organic users has changed over time - preferably from the date we started our SEO efforts. To do this, we’ll change our user segment.
.1. Click on the current segment - the default is All users .2. Then set the conditions to:. .1. Size: Session - medium .2. Fit mode: close fit .3. Fit mode: organic . 3. When this is done, we are left to change the date range for the results presented.
I have presented all the above steps in the following screen shot.
 .
.
The graph we get will show how the number of organic users has changed over the time period we selected.
A Regular increase in the number of organic users will be a sign that SEO efforts are effectiveand the page’s position in Google is increasing..
.
Conversion rate check
.
The next step is to check whether the traffic we bring to our store is valuable to us. After all, we have nothing from users who come to us and leave without a trace. .
For this purpose we will use conversion rate. This is nothing more than the percentage of users who performed your desired action - a conversion (in an online store it will usually be the completion of a purchase) in relation to the total number of users.

To be able to do this, however, we need to have an enhanced e-commerce report set upwhich will collect sales and conversion data through layers of data. This is the foundation without which you will have a hard time analyzing data from your online store. .
The topic of conversion rate counting was brilliantly explained by Kamila Kotowska in her post https://www.senuto.com/pl/blog/czym-jest-wspolczynnik-konwersji/, also I will not duplicate her and only encourage you to read her article. .
Google Analytics 4, unlike Universal Analytics, does not have a conversion rate column in its reports by default. However, we can very easily add it. .
To do this, all we need to do is to be in theTraffic Acquisitiontab, click the pencil icon in the upper right corner (Adjust report), and then in the report data we select Indicators. Our eyes will be shown a list of data currently in the report. At its bottom there is a selection list with the nameAdd Data. After clicking it, we select Conversion factorusers and save. .
When you already have an insight into the conversion rate, you are probably wondering how to evaluate its result. Unfortunately, it is difficult to answer this question. **It is assumed that the average conversion rate for online stores is 2-4%.**Depending on a number of factors, however, such as the industry or the target group of the store, these values can vary significantly.
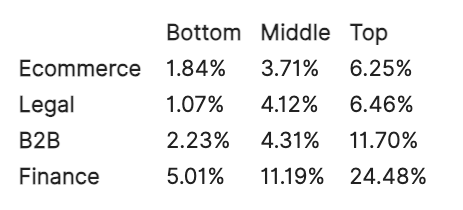 Average conversion values by industry (source https://adoric.com/blog/what-is-a-good-conversion-rate-2020/).
However, it is worth comparing what our conversion rate looks like from different channels. If it Organic Searchis significantly lower than from other traffic sources, it is likely that our content is not meeting the intent of our visitors or we are positioning ourselves for phrases that are not profitable.
Compare revenue to other channels
.
The ultimate goal of any SEO strategy should be to increase the amount of revenue generated by the channel. With the enhanced data from e-commerce configured, we can very easily see what revenue is being generated by each user source. .
To do this, we need to go to the report againTraffic Acquisition. There you will find a default column created Total revenue, located at the right end of the table. From the data we find there, we can easily assess the current profitability of individual traffic sources. .
For optimal evaluation of traffic sources, it is worth evaluating this data on an annual basis and comparing it with previous periods to the same extent. Otherwise, we may draw false conclusions due to the seasonality that prevails in the industry.
GSC SEO performance analysis
.
Worthy information about the effectiveness of our SEO efforts can also be drawn from another tool provided by Google - Google Search Console. In it we can find data on stricteusers coming from search results.
In this case, we should verify: .
- number of clicks and impressions, .- phrases that generate traffic, .- traffic-generating pages, .
Check the number of clicks and impressions
.
Clicks and impressions are the most important parameters in Google Search Console to measure the effectiveness of a website.
In simple terms, displays tell you how many users (probably) saw the link to your store in the search engine, Newsor in the module Google Discovery. Clicks, on the other hand, are already the number of clicks on those links. Each of these provided you with a visit to the store.
There is an obvious correlation between the number of impressions and clicks and the increase in sales on the store. The more visitors you get to your store, the greater the chance of increasing leads, conversions and sales..
The number of clicks and searches will be checked by selecting from the side menu the module Effectiveness (or Effectiveness -> Search resultsif we have access to other traffic sources). For a better view of the results, it’s a good idea to change the date range, setting the start date of your SEO efforts as the start date. .
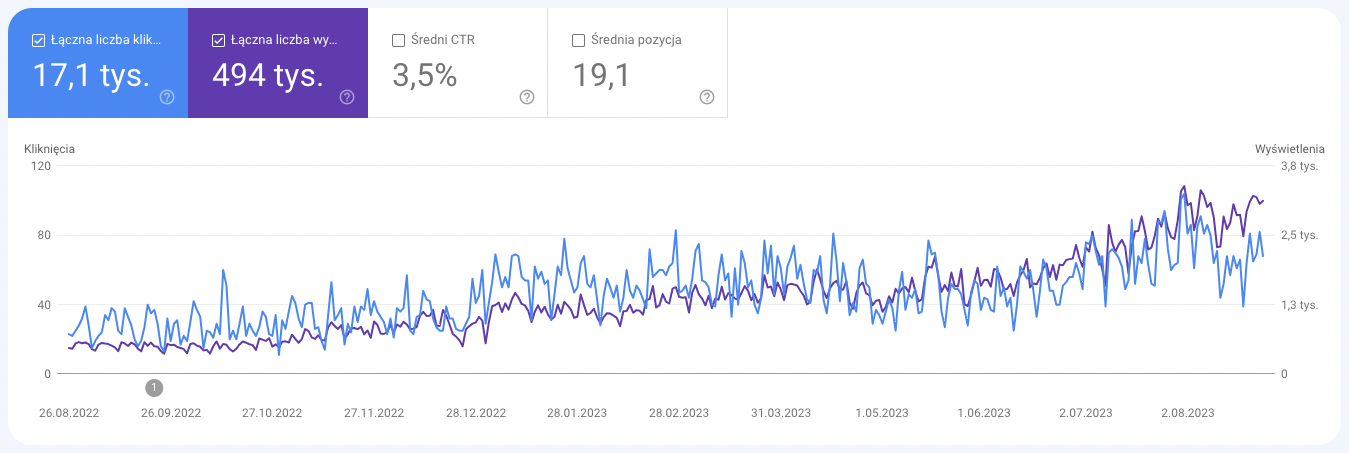
This report will easily show you how the site’s visibility and click-through rates have changed over time. If you wish, you can hide any of the variables by unchecking its tile at the top of the graph. .
Analyzing the number of impressions and clicks It’s worth remembering seasonality again, as periodic drops in the data may be due to it..
Verify phrases and traffic-generating pages
.
Another way to verify your SEO efforts is to see which phrases and pages generate the most traffic. This will help us find out if the store is positioning for the keywords we care about - these could be, for example, the product names with the most favorable margins or that generate the most revenue. .
For this, we again visit the Efficiencytab. This time our attention is directed a little lower - under the chart we analyzed previously. There we will find the dimensions that we can operate with when reviewing the report. For us, the first two will be the most important: Queriesand Pages. .
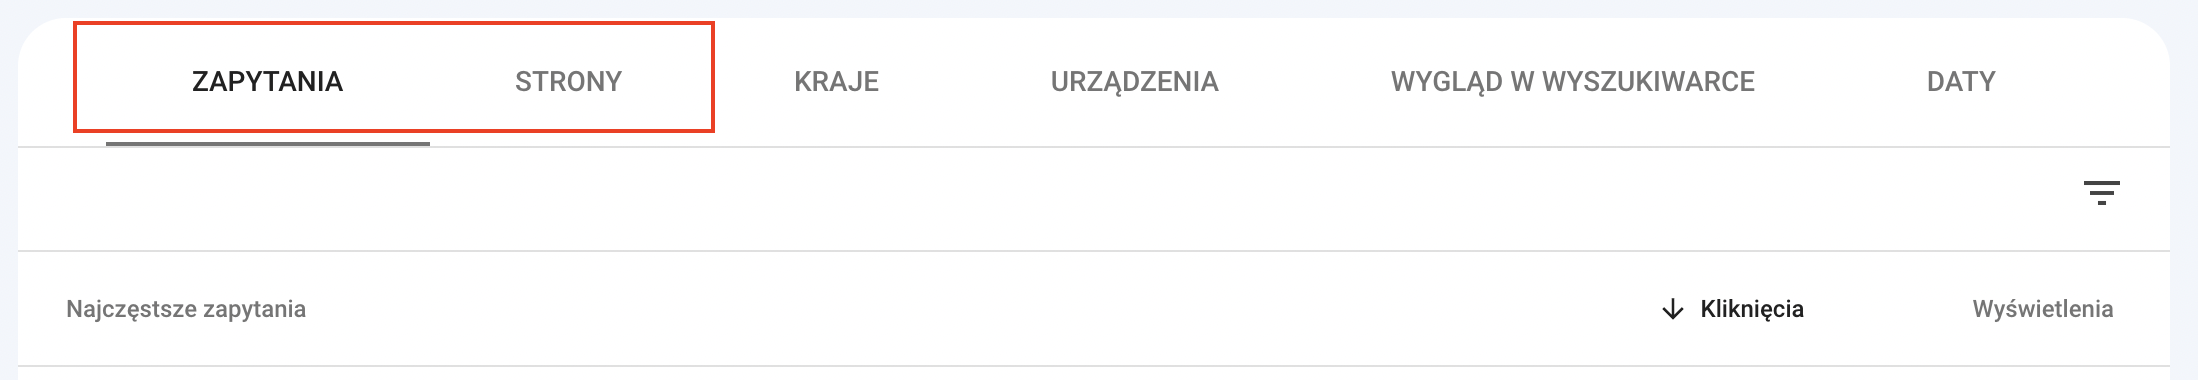
- Queriesinforms us after typing what phrase, our website was displayed to the user in Google search results.
- Pages is, in turn, a list of URLs that a user went to after entering your store from search results.
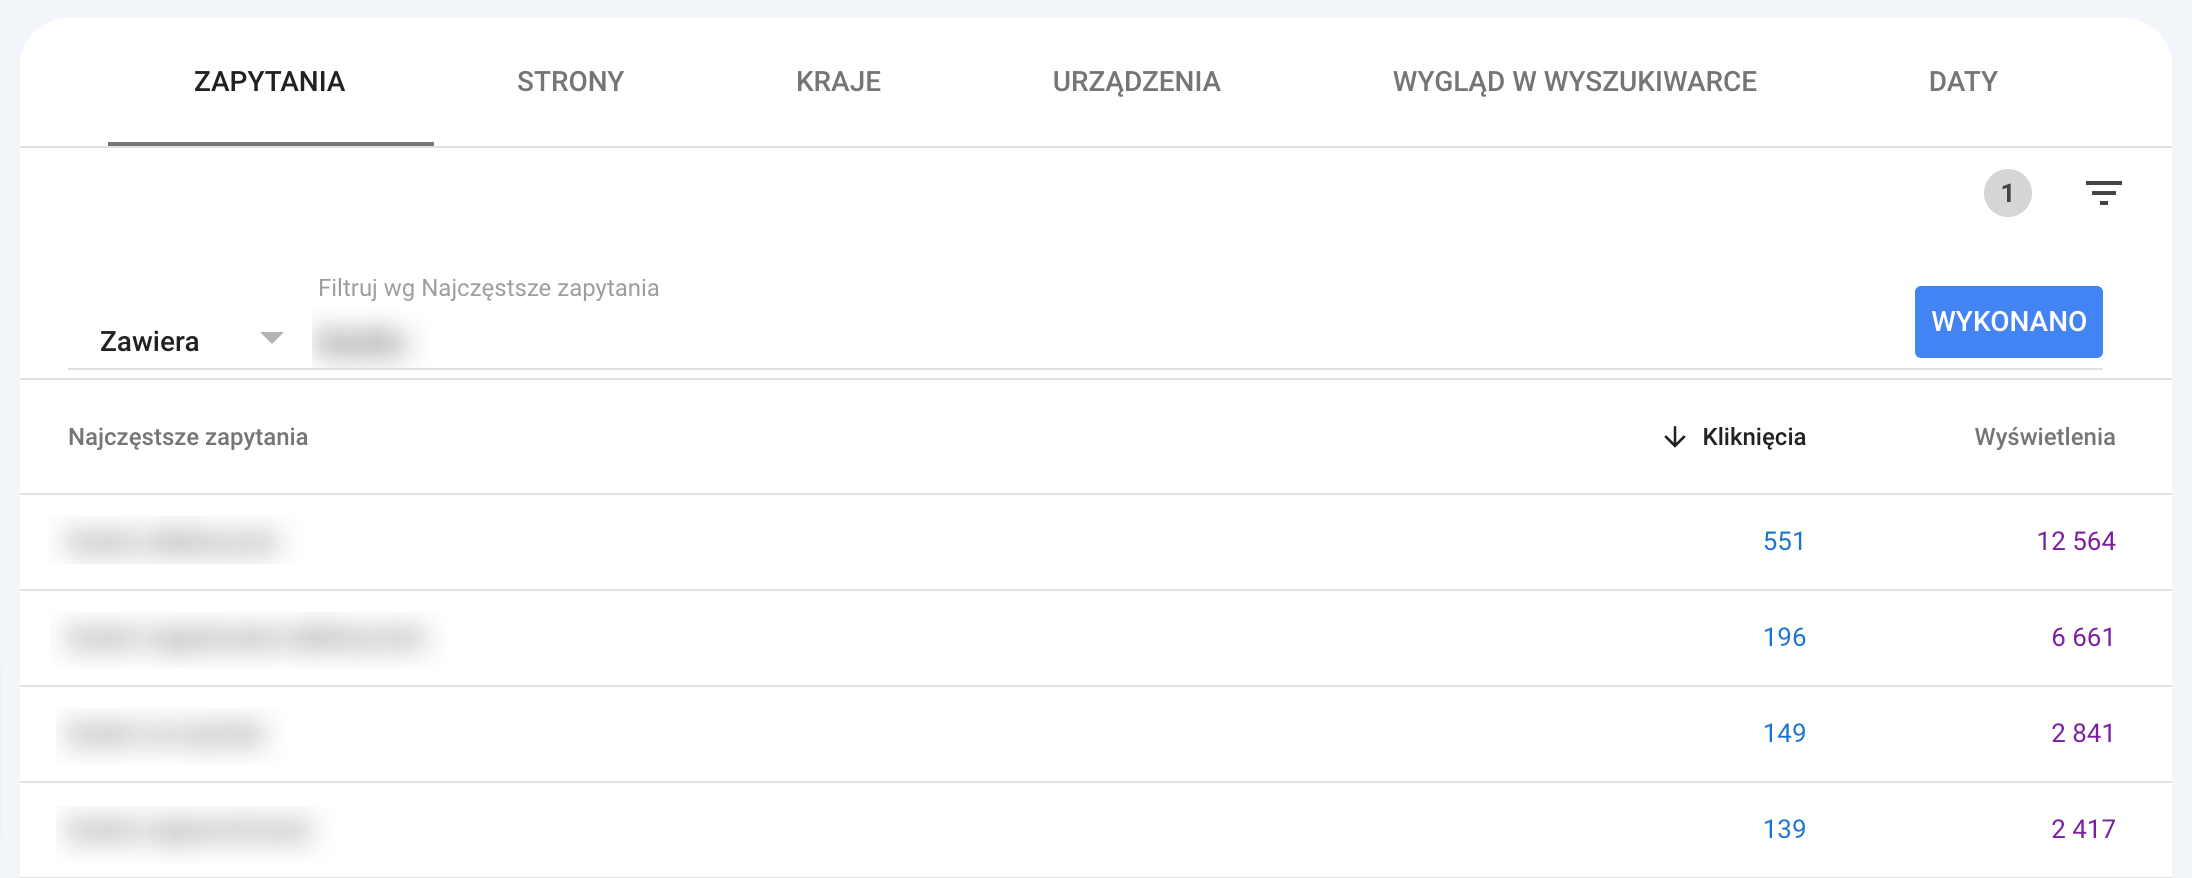
If you have difficulty finding the desired phrase or URL in the received list, then you can filter it manually. To do this, click on the three dashes on the right - when you hover over them, you will see the title Filter rows. Then select Frequent Queries/Most Popular Pagesand a box will appear above the table where you can enter the search term or URL - depending on the dimension you choose..
 .
.
To see how the click-through and display values for an item have changed over time, just click its row. The chart at the top will automatically filter the data..
Senuto SEO performance analysis
.
How else can you check your website’s SEO results? For example, in Senuto, whose interface is the easiest to use among the tools mentioned above. It also presents the data in a very clear and attractive way, making it easier to analyze. .
We have to remember in this case, however, that the information served by Senuto is only estimatedand may differ from that found in Google Analytics or Google Search Console. However, it is a great way to analyze the current situation of a domain and the trend it will follow.
Two modules will be useful in analyzing the performance and effectiveness of SEO efforts: .
-
.
- Visibility analysis .
-
Monitoring
Check overall visibility
.
First of all, it’s worth checking the overall visibility of our store. To do this, we need to go to the module Visibility Analysisand enter the domain address. .
You will then see the estimated traffic of the site and information on how many phrases it is ranked for:.
- TOP 3, .- TOP 10, .- TOP 50. .
This is a great way to measure the effects, because it shows the trend and changing number of phrases a site ranks for. Based on these, the estimated traffic is also calculated, depicting +/- the number of users the positions should bring to your site. The higher these values are, the better for our online store, of course.
When checking our store’s visibility, it’s worth benchmarking ourselves to our competitors to verify on an ongoing basis whether they are experiencing similar increases. To do this, we can go to the tabCompetition, where, after scrolling down a bit, we will find a table Best Competitors. In it, we will see how their visibility and phrases have changed in recent times. .
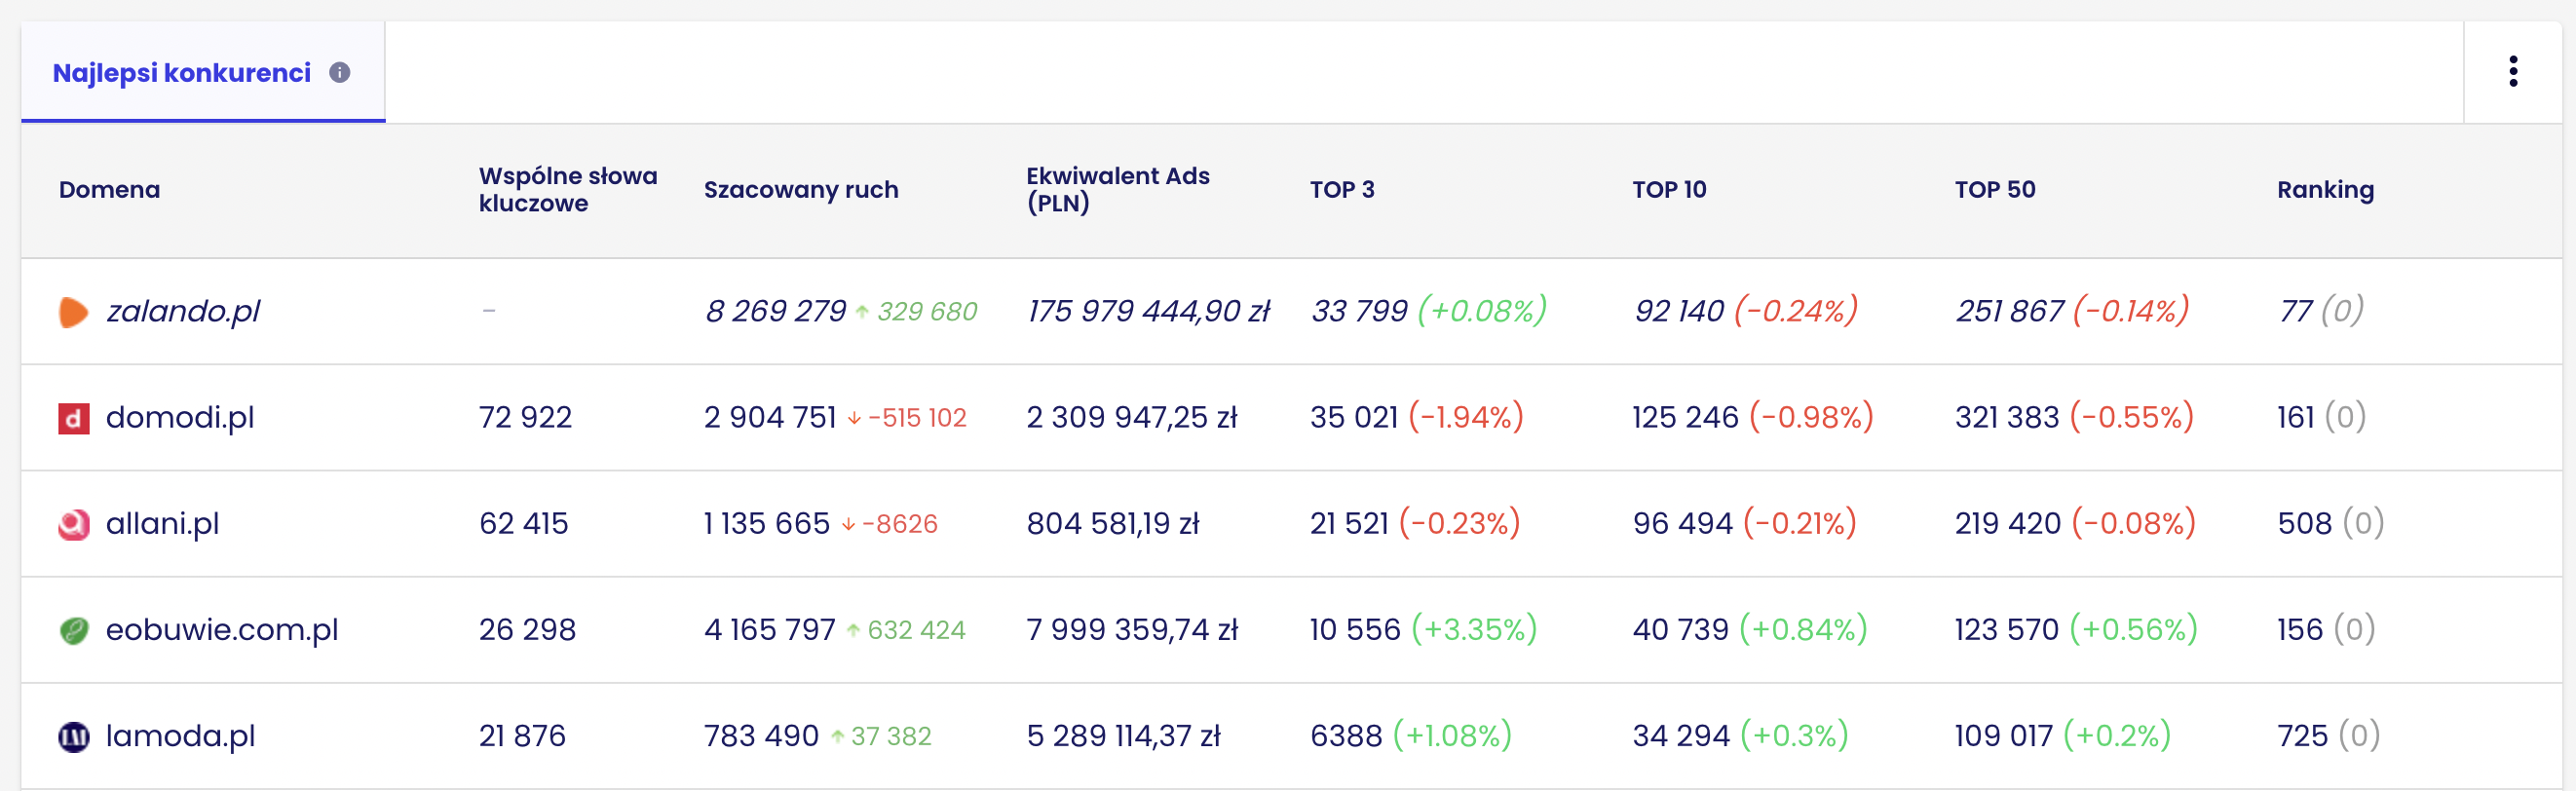
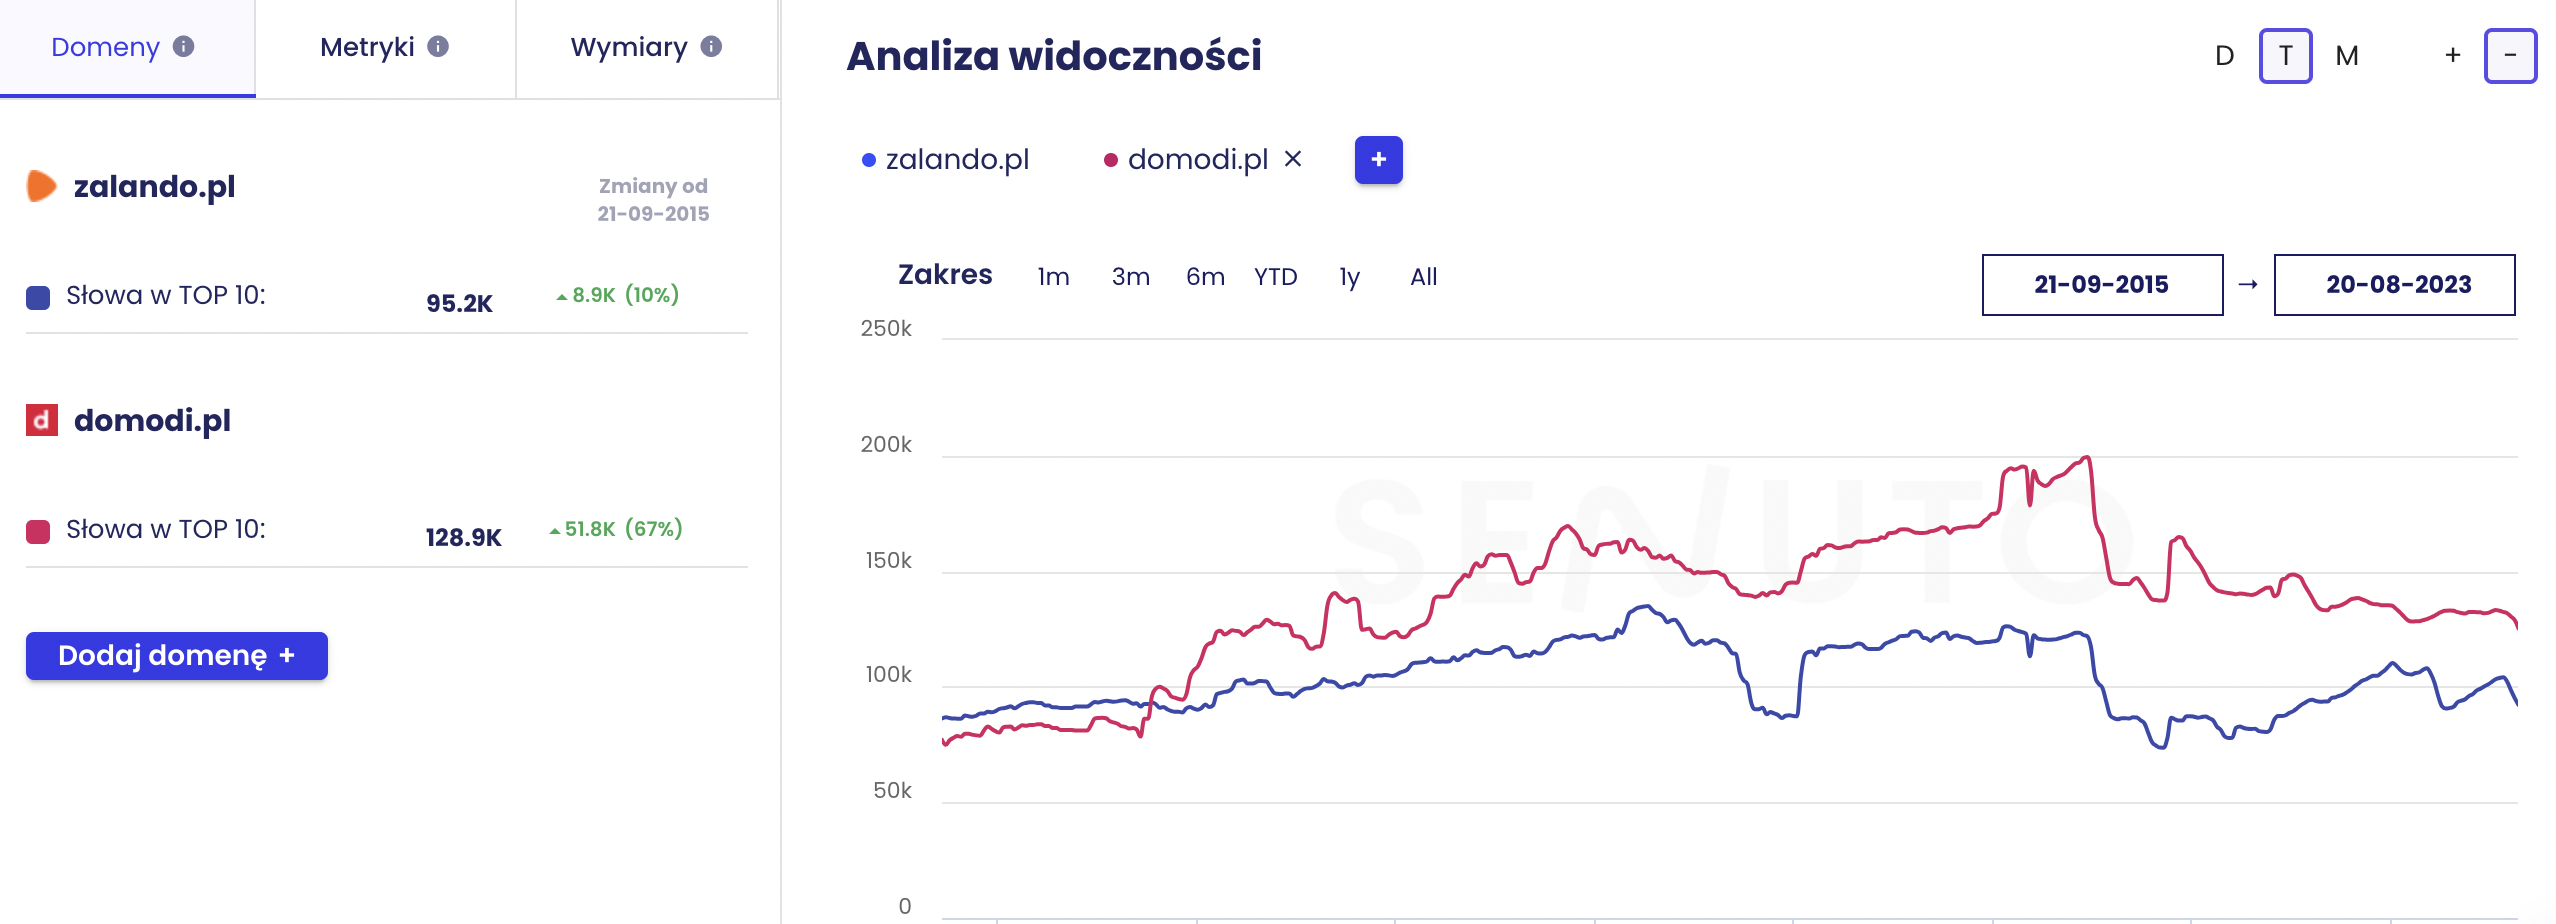
We can also present similar information on a chart by going to the Summary tab. .
When analyzing the visibility of our domain, clickAdd domainand enter the address of your competitor. We can add up to 3 competitors this way..
 .
.
Monitoring keyword positions
.
The last way to verify SEO results is to monitor the positions of keyword phrases of interest. However, this is usually not an optimal solution. Google personalizes the results, so it is hard to talk about the “position” of a given phrase these days. For most queries, these positions can change depending on location, device, user search history and many other factors..
Additionally, online stores generally have a wide range of offerings. The whole process of e-commerce positioning should be done comprehensively to strengthen the entire domain.
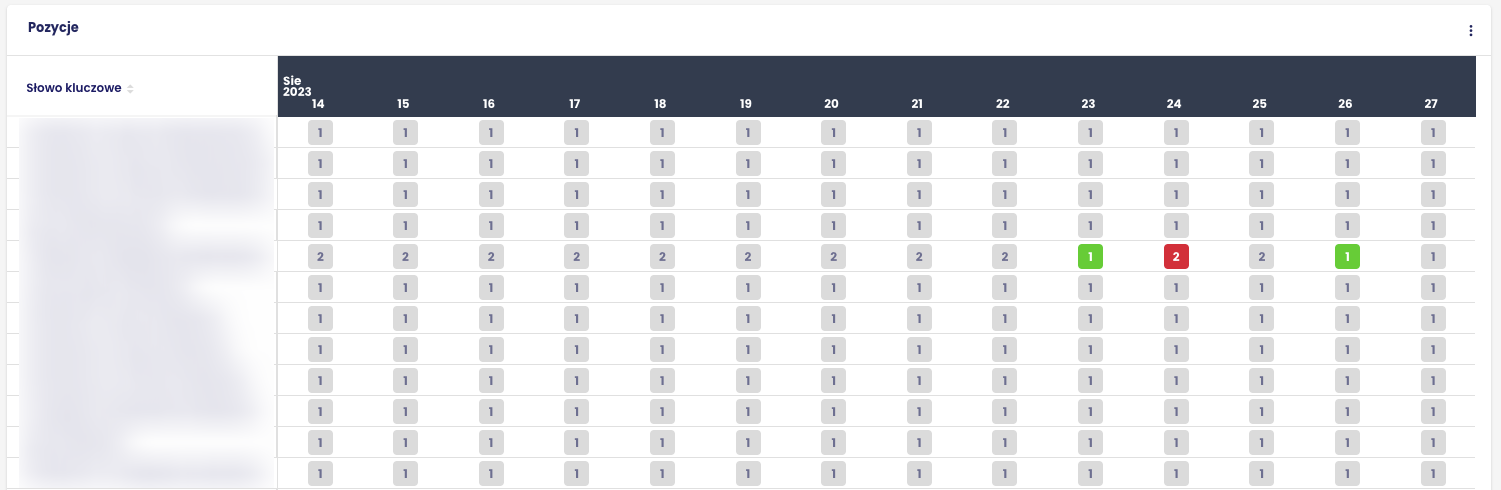
However, it still makes sense for some industries to monitor positions, and the MonitoringSenuto positions is a great place to do it. .
After you set up your project and enter the keyword phrases you’re interested in, underPosition Historyyou’ll find information on how the position of a phrase looked day by day. .
 .
.
This allows you to continuously analyze the position of a phrase and verify whether your store’s SEO is working or not. .
Read also: AI in e-commerce.

Wojciech Tumiel
SEO manager w agencji Netim. W codziennej pracy dba o cele klientów oraz rozwój zespołu SEO. W wolnych chwilach czynny gracz Fantasy Premier League.
All articles →