 Damian Sałkowski
 SEO has significantly evolved over the recent years. The process behind this concept used to be understood in a completely different way in, for example, 2010. There’re different search engine rules, billing models and approach to customers – virtually everything’s changed. Perhaps except one thing: to achieve outstanding results, one needs to tackle one’s tasks in a unique manner. Following in everyone’s footsteps is safe, but it doesn’t result in unparalleled performance, plus it devalues over time.
This article will show you a different approach to one of the most important SEO strategy elements now: content. Content is considered from every possible angle and in every possible context. It appears to be a perpetuum mobile of SEO. But is it actually true? What’s the role of demand, supply and customer journey in SEO planning?
SEO history in a nutshell
To comprehend it well, let me briefly recap SEO history for you in a very simplified model.
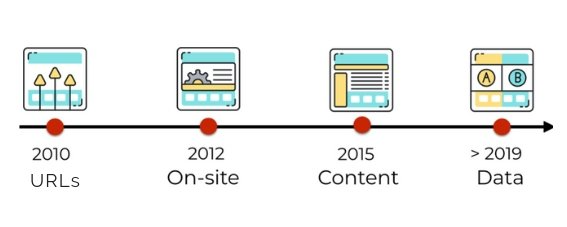
- 2010 – Everyone sources URLs. It doesn’t matter which ones, what matters is how many. Tools like Scrapebox, XRumer are present in the toolshed of almost every SEO specialist.
- 2012 – Development of front-end technologies – focus is more and more frequently put on technical SEO.
- 2015 – Penguin and Panda algorithms updates combined with growing popularity of content marketing are shaping a new trend – everyone creates content.
Naturally, trends in time overlap. Technical SEO is still an appealing concept and URLs are still important. I intend to show a fashion of sort in SEO. From time to time, the industry takes a different path and uses new concepts. It’s an effect of the fact that certain actions are only efficient when not universally followed.
Knowledge that’s becoming common
When a trend, e.g. technical SEO, emerges, there also appears a group of people who does the job well. Knowledge correctly applied gives them the edge over the others.
However, knowledge tends to become common. That’s what happened to URLs and that’s what’s happening to technical SEO. In the end, everyone will possess the knowledge that only few used to have.
This means that the mode of action which helped you stand out last year won’t help you get better results next year. That’s why SEO and various areas of marketing intertwine – it allows to get an advantage over the others, for some time at least.
The edge can also be gained with funds, but SEO has always had something magical in it that allowed David face Goliath. Creativity means a lot.
Data – yet another trend
Another trend I’ve been mentioning for a while are data. If you use them now, you’ll get an advantage over the others once again. At least until the others learn it. In two years, SEO specialists creating classifiers for machine learning won’t surprise me anymore.
I’d like to show you in this article how to harness this emerging trend and use it to optimize the already present trend – content.
Let’s have a look at the SEO-wise model of content creation that applies to a majority of cases:
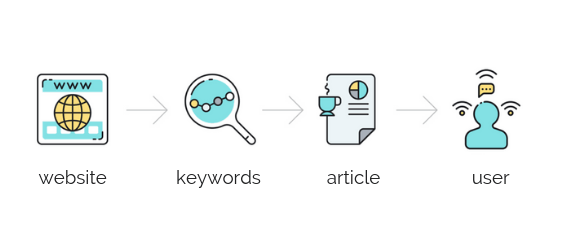
The process is very simple and involves 4 steps:
- Website – it’s your place to post content
- Keywords – it’s a response to users’ queries entered in the search engine. You’d like to answer such queries on your website
- Article – a standard posting process follows: you reveal your responses to queries submitted through posting content
- User – at the end of this road, at least in theory, you’ll stumble upon a user who’s submitted the queries we’ve answered in our content
The process seems to be logical. You’ve created a space for responding to queries submitted earlier and you’ve decided to answer them through content. Sometimes it really is the case, though when it comes to large websites or extensive industries with multi-step customer journey, then it’s not that simple. The entire advertising industry tends to be more and more focused on users.
Before I recommend a new process, let me ask you a few questions about the old one. Think of the following:
- Are you always in the place where users look for you?
- Has the topic you’re to tackle been already substantially covered?
It’s not so easy to answer these questions following the aforementioned process. Usually, focus in SEO is put on answering queries frequently submitted by search engine users. It’s not always the best idea. It happens that the process is optimized when its steps are reversed; let’s do this here.
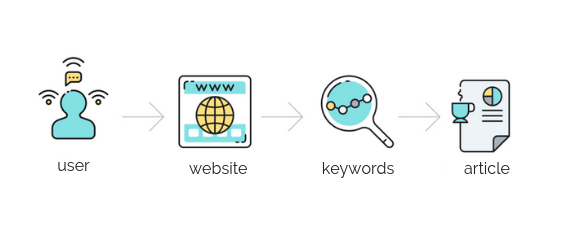
As you can see, the process in such an order starts with a user. When optimizing, one usually forgets that the end recipient is the user and one’s goal is to attract as many users interested in one’s products, services or content as possible.
In this process, your aim is to discover not only what the user wants, but also which information the user gets from others (competitors) in a given respect.
At this stage, it’s worth introducing three concepts into the creation process:
- Demand – the dictionary says that demand points to the intent to purchase goods and services of specific features, at a given time and in a given place; this definition applies to content as well. There is identifiable demand for particular content on the Internet.
- Supply –it’s a quantity of goods or services offered by the manufacturer or the service provider at a given price, in a given place and at a given time. Supply is a typical reaction to demand. Therefore, demand can be considered a need of an audience for specific content, whereas supply can be considered an amount of content already available online in response to demand at a given time.
- Customer journey –it’s a total of user/customer experiences with a company/brand.
Content based on customer journey
To better picture the concept of customer journey, let’s discuss the following example:

Most of us probably needed to buy tires at least once in our lives. The following can be said about this process (like about the process of buying almost anything else):
- It’s a multistep process – it’s not like a John Doe gets up in the morning and thinks to himself: “I want to buy 16 inch Yamaha 205 tires”. Before he comes up with such a conclusion, he reads reviews and opinions, and only after completing his journey he’s ready to make a purchase. This journey is also full of queries he entered into the search engine, which were different at each step of this entire process.
- It’s different for every persona – you probably know that it’s different when you buy tires as a mechanic and when you buy them as an ordinary driver.
- It may look different for each industry – I’m sure you know that buying perfumes is a much shorter process when compared to buying a house. Customer journey in the latter case will be much longer. That’s why you won’t be able to employ the same customer journey pattern in all the industries. Every brand or company should be oriented towards the destination to be reached by its customers from an idea to a purchase (however defined).
To make it simpler, I’ve proposed customer journey of a possible purchaser of tires.
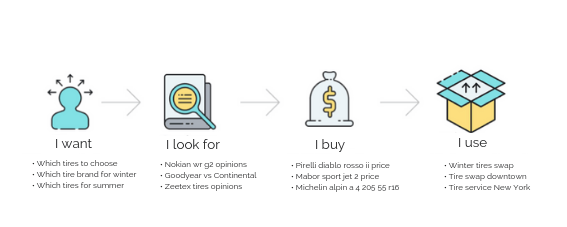
he textbook model consists of five steps:
- Awareness – when the customer is aware of their need for a particular product or service
- Consideration – when the customer considers a purchase. It’s when the customer reads reviews and opinions
- Acquisition – when the customer makes a purchase
- Service – when the customer uses the product or service purchased
- Loyalty – when the customer recommends the product or service or buys another one.
My simplified model lacks the Loyalty step – I couldn’t identify it for tires. I modified individual steps into the verbs: I want, I look for, I buy, I use.
Let me guide you through the process I completed to identify demand for and supply of content at individual purchasing steps.
Step 1 – Clustering of keywords
Identification of demand and supply requires a list of keywords searched in the context of the industry under analysis. It doesn’t have to be a full list of all queries entered by relevant users, but it needs to include quite a large group of words and phrases for each step of customer journey in order for the analysis to be useful.
Such a list can be drawn up in a number of ways.
Method 1: export of visible keywords for industry leaders
It’s a very simple method where you choose a few leaders in the tire industry and subsequently export words and phrases for which given websites are displayed in search results.
Then, when you have all such words and phrases, you identify a unique part (i.e. you delete duplicates). This results in the final list of keywords representative of a given industry.
Method 2: searching keywords for individual pathsin the keyword database
Sometimes good old keyword research will work as well.
This method allows to spot the right set of keywords.
Having the list of keywords, you need to cluster it by individual steps of customer journey. You must decide which keywords correspond to which step in our model.
I analyzed 2154 words and phrases from the tire industry. I assigned them to individual clusters according to my model of customer journey.
Step 2 – Identify demand
Having clustered the foregoing, you can identify demand for content at individual steps of customer journey. As you can see, I handpicked 2154 words and phrases – these aren’t all searches on Google for tires, but it’s a considerable sample for analysis.
Identification of demand is easy – I added a monthly total of searches of words and phrases at individual steps.
I got the following figures:
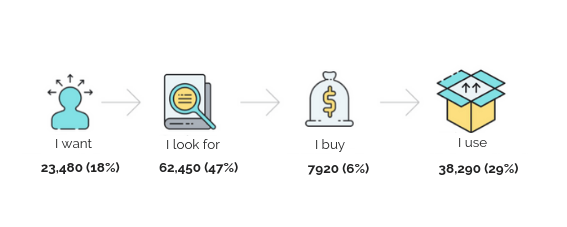
This means that 18% of users are only at the Awareness step, 47% of them are already looking for tires, 6% of them (only!) are buying tires and 29% of users are using them.
Step 3 – Identify supply
Identification of supply is supposed to help you establish how the market reacts to demand of users. What’s interesting here is how much content at individual steps of customer journey is available on the Internet.
Senuto has developed a system enabling to identify supply of content[ in an individual customer journey, but you may perform such an analysis on your own. Supply identification models are countless, ours is just a recommendation. Generally speaking, keywords in individual journeys are parameterized with e.g. allintext and allinanchor. A total of such queries for all the words and phrases translates into supply of content in a particular customer journey.
I got the following:
| I want | I look for | I buy | I use | Total | |
| Demand (value) | 23,480 | 62,450 | 7,920 | 38,290 | 132,140 |
| Demand (%) | 18% | 47% | 6% | 29% | – |
| Supply | 1,540,268,865 | 1,044 ,534,885 | 165,772,960 | 98,226,129 | 2,848,802,839 |
| Supply (%) | 54% | 37% | 6% | 3% | – |
*% means how many queries or results are for keywords at individual steps of customer journey
*Value means absolute values at individual steps of customer journey following from the analysis
Conclusions
- There’s oversupply of content at the “I want” step. Users have too much to choose from and you’ll find it difficult to get higher visibility. However, this doesn’t mean you shouldn’t be more visible. You always ought to strive to be where your users are.
- The “I look for” step is also quite full of content, though demand here is very high as well.
- At the “I buy” step, there’s a great correlation between demand and supply.
- The “I use” step is marked with very low supply and pretty high demand. Here, it’s as easy to generate traffic and feed your content to users as it gets. It’s true that content creation at this step could be deemed pointless, but such content builds loyalty among customers.
We’ve gone through the process from the industry evaluation, but the analysis will make sense only if it’s compared to something and given some context. Let’s make a comparison with the leader in the Polish tire market as well as with other similar platforms.
Specific cases

Oponeo is the largest online store in Poland offering tires.
Let’s see how Oponeo responds to market demand and supply in terms of content.
Market supply vs Oponeo supply
| I want | I look for | I buy | I use | |
| Oponeo supply | 17.40% | 33.04% | 49.53% | 0.03% |
| Market supply | 54% | 37% | 6% | 3% |
The aforementioned data lead to the following conclusions:
Oponeo puts more emphasis on content at the “I buy” step when compared to the market. It’s typical of an online store.
At the “I want” step, Oponeo has much less content (as a percentage) than the market.
Having compared Oponeo supply and market demand, it looks as follows:
| I want | I look for | I buy | I use | |
| Oponeo supply (%) | 17.40% | 33.04% | 49.53% | 0.03% |
| Market demand (%) | 18% | 47% | 6% | 29% |
We can draw the following conclusions:
- Oponeo supply of content responds to the demand structure quite well, although due to the market oversupply of content, providers still need to compete to attract users.
- At the “I look” step, market demand slightly exceeds Oponeo supply; this results from the fact Oponeo might lack some tire models and brands in the products offered.
- Very low supply when compared to demand is currently noticeable at the “I use” step. Thus, it’s worth thinking about creating content for this area.
- It’s also worth checking what supply looks like when compared to demand among other platforms.
| I want | I look for | I buy | I use | |
| Demand | 18% | 47% | 6% | 29% |
| Oponeo.pl | 17.40% | 33.04% | 49.53% | 0.03% |
| allegro.pl | 23% | 55% | 13% | 9% |
| auto-swiat.pl | 100% | 0% | 0% | 0% |
| autocentrum.pl | 16% | 66% | 4% | 14% |
| autokult.pl | 82% | 13% | 1% | 4% |
| ceneo.pl | 3% | 75% | 16% | 6% |
| facebook.com | 62% | 13% | 23% | 2% |
| forumsamochodowe.pl | 83% | 13% | 2% | 2% |
| linkedin.com | 88% | 10% | 1% | 1% |
| mojeauto.pl | 8% | 78% | 7% | 7% |
| moto.pl | 24% | 58% | 9% | 9% |
| motofakty.pl | 83% | 11% | 1% | 5% |
| olx.pl | 4% | 69% | 15% | 11% |
| opony.com | 100% | 0% | 0% | 0% |
| opony.pl | 45% | 46% | 9% | 0% |
| oponytanio.pl | 32% | 50% | 17% | 1% |
| twitter.com | 15% | 49% | 35% | 1% |
Social media analysis
I performed the same analysis for other platforms:
- Large online stores
- Social media platforms
- Price comparison engines and classifieds websites.
In addition to drawing a comparison with competitors (which might be misleading), I can establish at which step of customer journey the user uses individual social media platforms. This will allow me to determine how to plan communication efforts there.
Knowing that Facebook users are rather at the Awareness step, I know what type of content they can find interesting. On the other hand, knowing that Twitter users are still searching what they need, I can decide what may appeal to them.
As you can see, the table above contains both platforms completely focused on the “I want” step (auto-swiat.pl) and platforms which, with their supply model, fit the demand model well (autocentrum.pl).
Demand, supply and customer journey in SEO planning – summary
Naturally, all of the aforementioned conclusions regarding individual platforms are of subjective nature. It’s not easy to be objective because of the brand strategy. My analysis was supposed to show the methodology and possible conclusions.
You can notice that after the reversal of a seemingly good process we’ve arrived at conclusions that probably couldn’t be arrived at in the original process. Working with huge amounts of data, you’re able to look at your process from a broader perspective. This allows you to better strategize and strive for expected results more efficiently.
Two conclusions are drawn for the SEO industry:
- It’s worth looking for market gaps. Even the tire industry has areas with high demand and low supply.
- It’s worth answering queries of users and not focusing exclusively on keyword popularity. You need to be always where your customers are, i.e. to be with them throughout their entire journey – and if you don’t have a customer journey model in place, you’ll find it extremely difficult to do.