Core Web Vitals - how to adjust the site under Google's new guidelines?

Google’s algorithm update announced for 2021 involves the inclusion of so-called Core Web Vitals, or Core Web Metrics, as a factor affecting page rankings. This change is interesting for several reasons, and at the same time provokes a lot of questions and doubts. Let’s try to find answers to the most pressing issues to better prepare for the upcoming update.
Why do I say thatthe Web Vitals-related algorithm change is interesting? First, it is a strong shift in the center of gravity of site evaluation toward UX principles. Second, the emergence of several new concepts is causing visible confusion among professionals and clients. Third, and most importantly: this is the best prepared algorithm update by Google to date. The amount of material and tools at our disposal means that virtually nothing here is a mystery.
.
Do you prefer video?
.
Watch the webinar in which Robert Niechciał, Partner at Vestigio, talked about how to prepare for Core Web Vitals:
.
Is the introduction of Web Vitals assessment something new?
.
No. We’re not talking about a complete novelty here - just a evolution of Google’s previous ways of evaluating the speed and quality of web pages. Google has been using page speed as one of its ranking factors since 2010. Back then, the speed of response during Googlebot visits to the desktop version (usually the only one at the time) was taken into account. Over time, the evaluation evolved, began to take into account factors that realistically affect how users feel about a site’s speed, and was spread to mobile versions as well.
Thus, we have been dealing with the noticeable impact of a site’s speed on how the algorithm will rate it since at least 2018.
Over time, there was a need for a new look at the problem of site speed and quality. Before a long time, SEO specialists tried to improve site speed in a broad sense, using GSC data or tools such as PageSpeed Insights, Lighthouse or WebPageTest. However, this was difficult, and often the struggle for 100 points in the PageSpeed test was not justified by real benefits in terms of growth in rankings.
Google, in my opinion, in 2021 decided to simplify the matter (against all odds) and give an answer to the question: what is a good website.
Well, a good website has:.
-
Show the most important part of the content quickly,
.
-
Give the opportunity for quick interaction, .3. Maintain stability during loading (the page template is not supposed to jump - after all, we all love to click on the wrong thing we wanted because the page suddenly moved ????)
The above, then, are the three new basic indicators of website quality..

What is Core Web Vitals?
.
Core Web Vitals translates as Core Web Vitals. There are three of these core indicators and they are hidden under the following abbreviations:
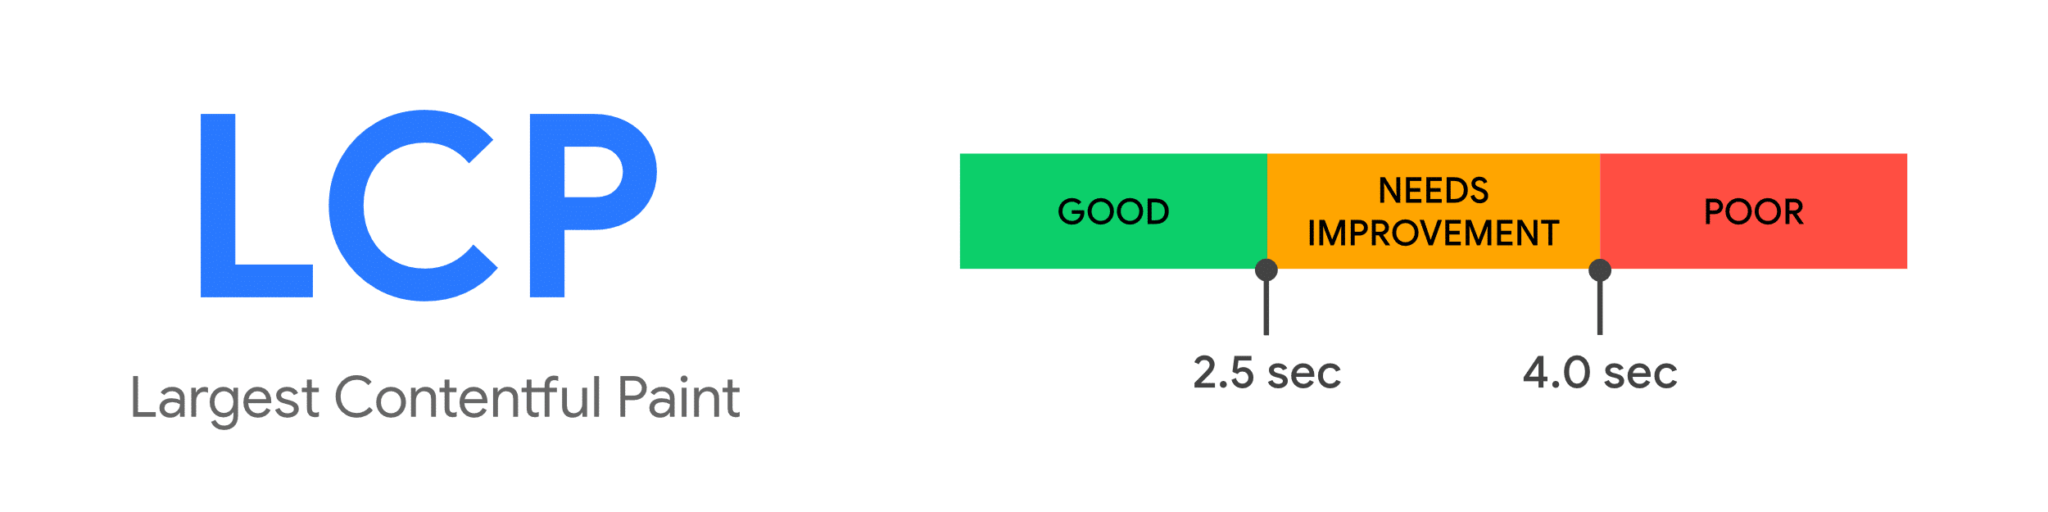
LCP - Largest Contentful Paint
.
This indicator relates to speed of access to information. It defines the experience of loading a website, calculated as the time from the beginning of loading, until the Largest Contentful Paint (LCP) is fully displayed. The LCP allows you to determine whether a page is quickly making the information the user wants available. If this time is less than 2.5 seconds, the rating is good. If above 4 seconds, the rating is negative.
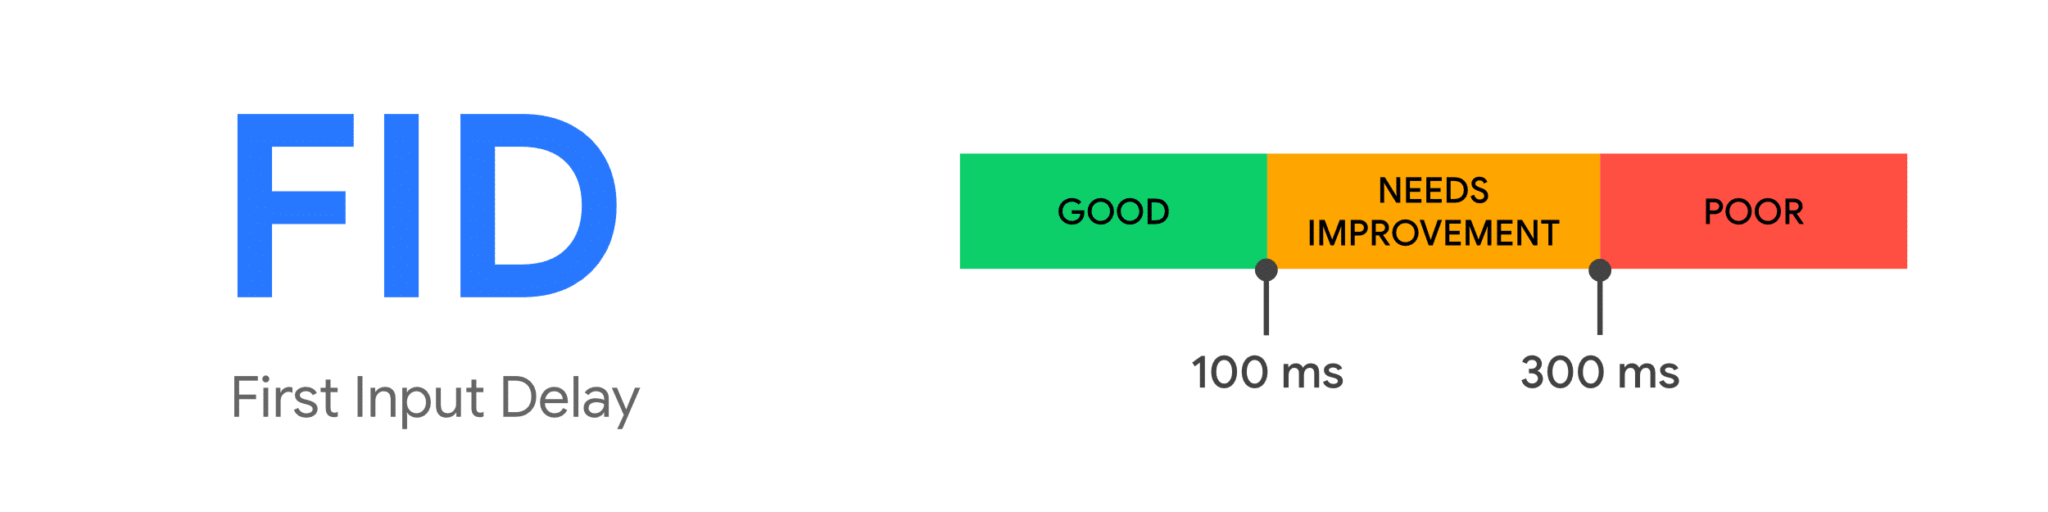
FID - First Input Delay
.
Determinesthe interactivity of the site, that is, how quickly it responds to our behavior. If the time is less than 100 milliseconds, we get a good rating. If above 300 milliseconds - bad.
CLS - Cumulative Layout Shift
.
The most interesting of Web Vitals indicators and a real novelty. It can be translated as cumulative page template shift.
This indicator determines,to what extent the loaded page has shifted on the screen due to unexpected behavior..
By unexpected behavior we mean template shifts not caused by intentional user interaction.
A rating below 0.1 is a good rating, above 0.25 is a bad rating.
It is worth mentioning that these are not separate and independent indicators. They form a kind of “site quality triangle” and taking care of one of its “sides” requires taking care of the others or will indirectly affect them.
Have the previous speed rating factors ceased to matter?
.
No. The current Core Web Vitals have become a kind ofumbrella that combines many of the page speed metrics previously used by Google and SEO specialists..
For example, LCP is dependent on TTFB (Time to First Byte) and FCP (First Contentful Paint). FID can be affected by TBT (Total Blocking Time) and TTI (Time To Interactive). And although the cited metrics do not directly count as Core Web Vitals, they are still useful in our analysis.
In addition, Google has announced that the current composition of Core Web Vitals is not final - instead, it is the most relevant now. As the Internet evolves, the list of Core Web Vitals may be expanded.
In summary:if your site previously received high PageSpeed ratings and was taken care of in terms of user experience, most likely not much will change for you..
Are we in for SEO Armageddon?
.
Don’t.
1 As I mentioned earlier, this update is not a revolution, but an evolution. It is a change that, despite appearances, is quite obvious and easy to predict. It can be concluded that if your site previously relied on PageSpeed metrics, it will come out of the update rather defensively.
2 Its impact will not be decisive. This update will join the ranks of factors of medium impact. Noticeable, but not crucial. Probably particularly acute for large publishers. Rather, each site will see visibility movements, but if you have a domain with strong authority and good content, but average Web Vitals, you don’t have to worry about being jumped by a technically excellent site, but without the foundation of visibility in the form of content and authority.
- due to the fact that Google has placed a strong emphasis on clarity and transparency with this update - we have the time and knowledge needed to improve our metrics..
I have a great new site - am I safe?
.
Usually, unfortunately, no!
The basic sin of current web development is the emphasis on the speed of preparing and implementing a new site for the client. This is usually done by using off-the-shelf frameworks and standard CSS and JavaScript kits without considering which pieces of code are realistically needed for the site to function.
Therefore, if when designing a new site, strong support from an SEO specialist and audits performance is not taken into account even at the design stage, we can be sure that the site will be overloaded with code. And this negatively affects every aspect of Web Vitals.
Surprisingly, we’ve reached a situation where old sites that make little (or no) use of CSS and JavaScript get perfect PageSpeed and Web Vitals ratings. Although they don’t adhere to the principles of modern web building and user experience, they get around many of the problems associated with sloppy use of modern techniques.
What influences Largest Contentful Paint?
.
Despite the fact that all three indicators theoretically talk about something else, they are actually all connected and influence each other. In my opinion, the most important of them is LCP, combining many of the speed factors we have considered in the analyses so far. Correct implementation of LCP recommendations will also affect CLS and FID to the greatest extent.
Server response speed
.
The most common bottleneck, affecting the loading of the page and the main part of the content, is the speed of the server response. It is common to reach even more than 1 second here, which leaves us little time to load the rest of the resources and get a good rating. To improve the LCP rate we can:
- Optimize the server. There are different recommended configurations depending on the type of your site and the CMS used - so optimization is a task for administrators. Often, the solutions you use have a significant impact - if we are talking about shared hosting, it is often necessary to move to a higher plan or use dedicated servers, or the cloud with guaranteed resources suitable for our traffic and generated load.
- Use a Content Delivery Network. If we operate in multiple geographic markets at the same time, a good solution is to use a CDN, serving the customer our static content from the server located closest to them.
- Use caching mechanisms.Using reverse proxies or various solutions, such as caching database queries, will free up server resources for a large portion of queries, making them execute faster. .- Serving static HTML.This solution, used by many site acceleration modules, is popular, for example, for CMS Wordpress. Thanks to this, the use of the server is reduced to a minimum, and the static file is sent to the user’s browser in the blink of an eye.
- .
Optimizing graphics
.
A common mistake is the use of unoptimized graphics - sometimes even weighing several megabytes of images scaled on the page.
To save time loading graphics remember:
- use graphics sizes appropriate for our site, .- use compression of graphic files, .- use modern formats such as WebP. .
Optimize JavaScript and CSS
.
As I mentioned earlier, modern sites are often overloaded with unnecessary JavaScript and CSS code. Not only do these files have to be downloaded from the server, but in addition the browser has to analyze them in order to display the page to the user.
To improve speed you can:.
- minimize the JS and CSS content - perform an analysis of which code snippets are realistically used by the browser. There’s a good chance that many of the JS and CSS resources you load on the page are never used, .- fragments of CSS code crucial to displaying the page can be placed directly in the HTML code, .- take advantage of asynchronous loading and delay the use of resources that are not crucial, .
A good tip is to consider whether I actually need to load something. This applies to JS, CSS and graphics resources as well.
How to Optimize First Input Delay?
.
In the case of First Input Delay, you can see best how interconnected the different elements of Web Vitals are. If we have taken care to implement the recommendations for Cumulative Layout Shift as well as possible, there is a good chance that FID will no longer be a problem.
Google points out as the most important element spoiling our FID rating… overloading and bad JavaScript optimization, an element I already mentioned above.
When a user’s browser is blocked by JavaScript code analysis, there is a delay in responding to user behavior. To prevent this, it is additionally suggested:
- Avoid long tasks - any block of code that takes more than 50 ms is an error. .- Divide code into smaller chunks that can be executed more quickly. .- Take a sensible approach to external scripts. .- Apply delayed or asynchronous loading of all non-essential scripts (those that are not relevant to LCP and CLS). .
How does optimization look like under Cumulative Layout Shift?
.

Often, determining what’s causing our site’s layout shifting problems is possible by simply refreshing the page. However, a more accurate determination of the problem requires additional tools. Let’s also keep in mind that previous recommendations, such as resource loading speed or avoiding page reloading through scripts and stylesheets, also affect CLS.
Most common problems that cause low CLS rating
.
The most common CLS issues arise when an element “crams” into the page structure already loaded and presented to the user. This applies to many potential site elements, such as fonts that load too late and change before the user’s eyes. However, the most common problem is with the graphics and images used on the site.
Graphics without indicated sizes
.
In the old days, adding width and height parameters in HTML to graphics was considered a good custom. Nowadays, this is often overlooked, causing the template to start adjusting to the loaded graphic. This is often seen with blog posts and the main image above the text, which loads after the text is loaded and is a classic example of layout shifting. To avoid this, you should keep graphics uniform in size, reserve adequate space in the template for graphics that have not yet loaded, and revert to setting the height and width of graphics using CSS.
Examples of problems with graphic sizes include:
- logo in the mobile version with unreserved space suddenly stretches the header, pushing the page down when it loads, .- fine graphics used on the site whose sizes are not specified, .- carousels! - Yes, they are still used, and all it takes is for one of the graphics in the rotation to be larger or smaller than the rest and we have a template shift ready.
Internal banners or popups
.
A common form of additional internal promotion are banners loaded when the page loads, encouraging you to sign up for a newsletter, download an app or informing you about current promotions. They cause the entire page to move down. In addition, when scripts that support this mechanism load too late, it causes additional milliseconds of layout shift and a drop in CLS rating.
Adverts
.
This is the biggest problem for large publishers, who often sell their space in the RTB method. Usually, when a separate auction of advertisers is held for each user, a certain amount of time passes, plus it is not always clear which ad (of what size) will ultimately win. This causes frequent template shifts and accidental clicks by users.
This is due to the shifting of the layout, which depends on the final format of the ad.
To solve this, you should:.
- as far as possible focus on one ad format in the section above the fold, .- reserve enough space in the page structure for the selected ad format, so that after the advertisers auction and load the format, it does not stretch our template.
Both of these solutions are certainly not easy and will cause a lot of internal discussions between SEOs and those responsible for traffic monetization.
What tools to measure Web Vitals?
.
When it comes to the change that is Web Vitals, it must be said that Google has prepared us well for it. The amount of materials and tools needed to understand, diagnose and fix the indicators is very large.
Depending on how much you want to delve into the problem - you will find the right tool.
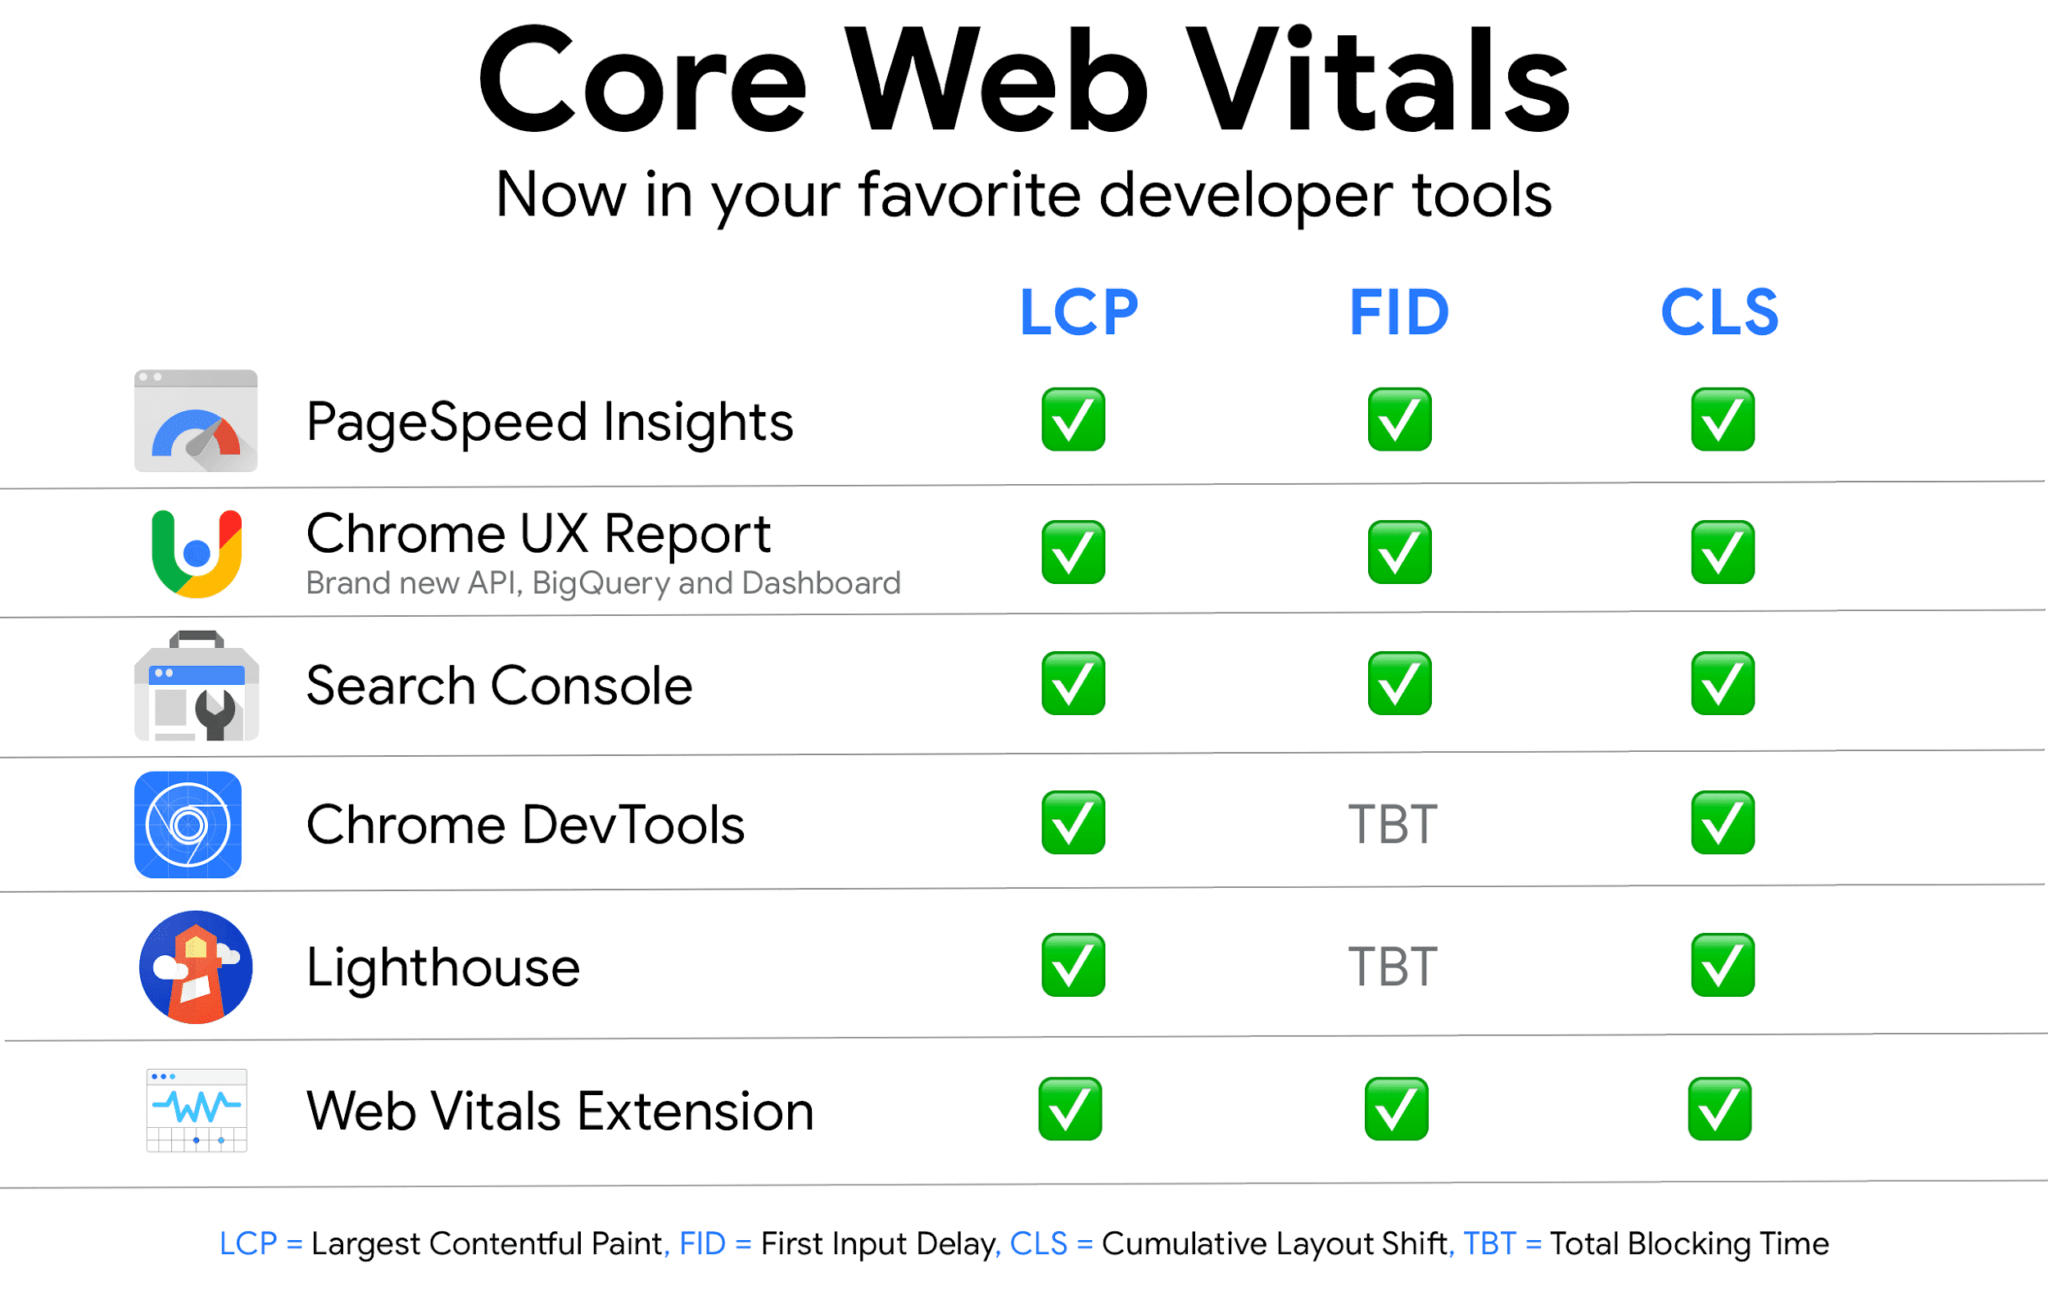
Google Search Console
.
The primary tool to check is, of course, Google Search Console, which allows us to look at our site as a whole through the eyes of the search engine. Google has been releasing Web Vitals / Basic Web Metrics reports in GSC for a few months now. The reports are available by mobile device and computer and show the change in our site’s rating levels over time. This allows us to link a sudden drop in the quality of our pages to changes on the site.
An important feature of GSC’s Web Vitals reports is the grouping of subpages. This is in line with the principles of SEO evaluation, where we first try to find problems occurring on our site globally, then locally, and finally individually. In this way, we can isolate specific groups of subpages, such as product subpages, that share the same problems and we can solve them in one go.
However, a more detailed analysis will require additional tools that already analyze individual pages.
Chrome Web Vitals Extension plugin
.
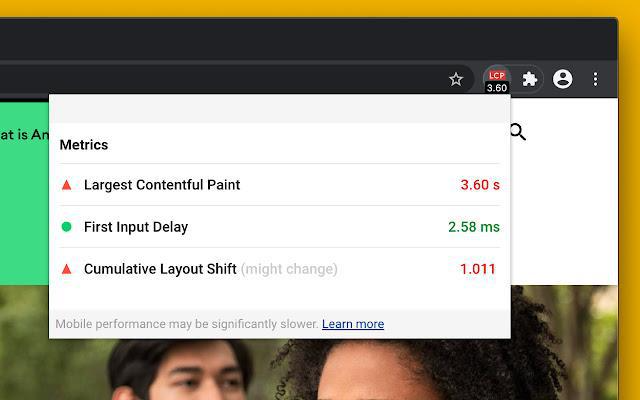
To quickly check the metrics of the sub-page we are on, we can use the Google-recommended Web Vitals Extension plugin. It allows for a quick and convenient analysis - but does not include data relevant to potentially fixing our site’s problems.
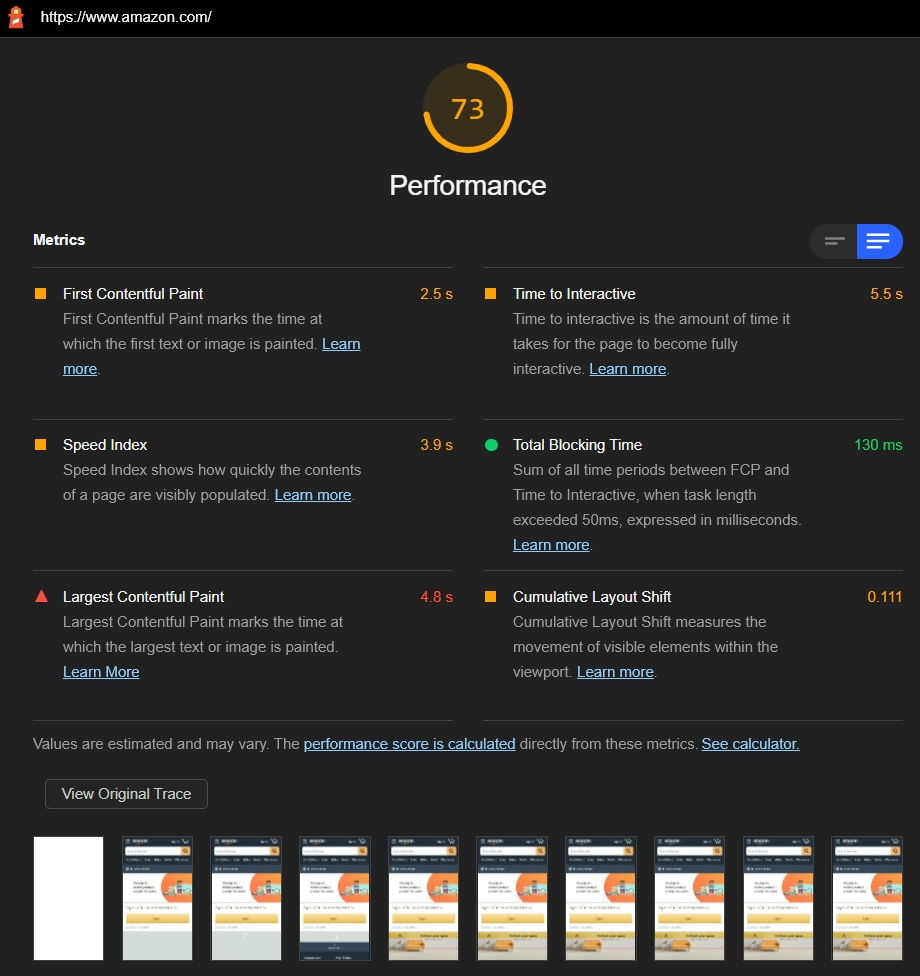
Lighthouse
.
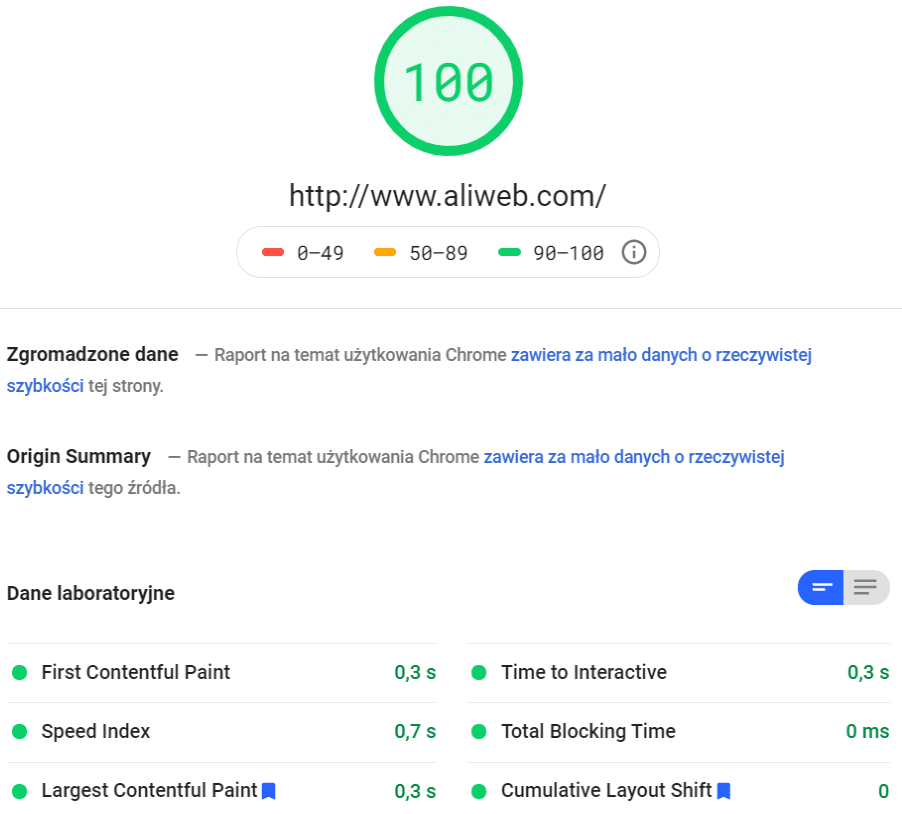
Available in Chrome Browser Developer Tools, Lighthouse reports allow you to perform several automatic audits, including, of course, performance reports, simulating a mobile or desktop device. Performance reports, a kind of copy of PageSpeed, show quickly and efficiently the most important indicators of Web Vitals and, importantly, the fields for improvement we should pay attention to in order to get a better rating.
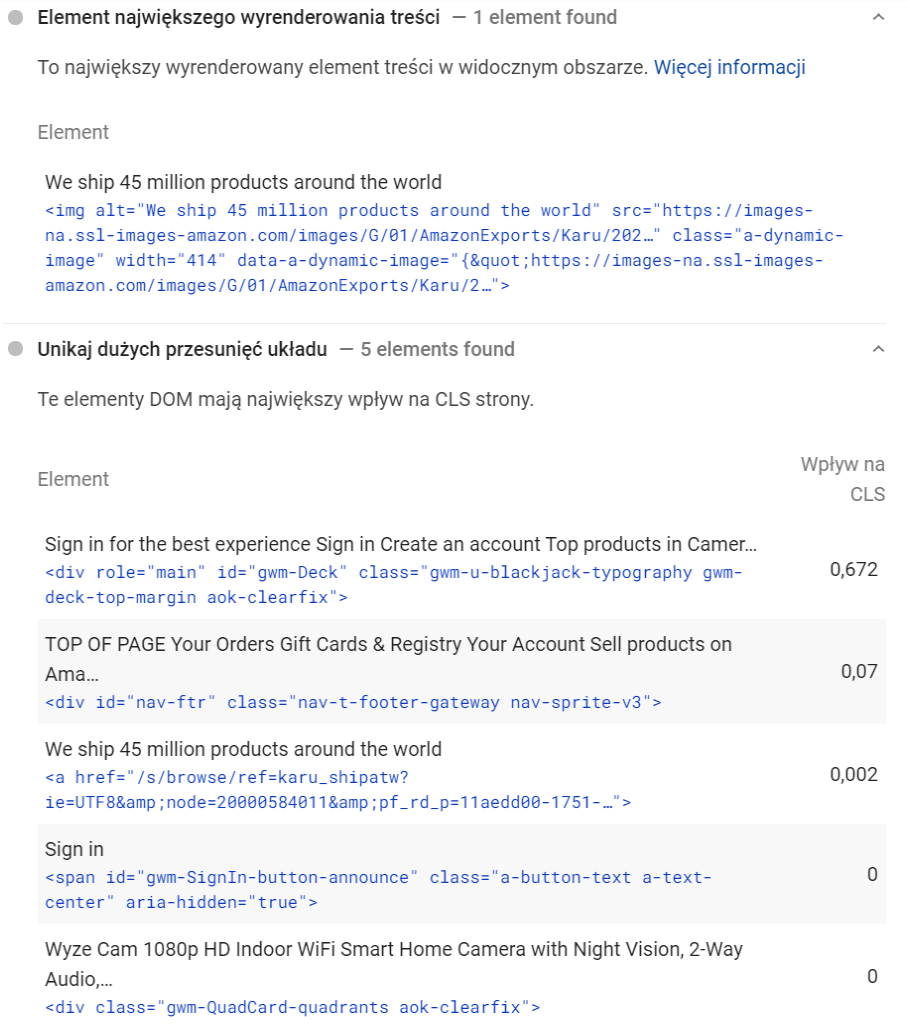
PageSpeed Insights
.
The functionality of PageSpeed and the information we get largely overlap with Lighthouse reports. In both tools, we get information on which scripts are causing thread locking, which contain unused code, and what other fixes should be implemented to improve Web Vitals in general.
A good feature is to pinpoint exactly which parts of our site are causing a low rating, which HTML code elements are the ones that “jump”, causing a drop in CLS, and importantly, which code snippet is considered Main Content by Google and affects LCP.
Developer Tools
.
At the very end, the best tool that will be useful for us to analyze the site in detail. While Google Search Console gives us clues that something is wrong, PageSpeed or Lighthouse show us where we can improve something, Chrome pinpoints exactly which script or code element is ruining our Web Vitals rating..
Given that Chrome’s built-in tools and their use in SEO is a potential for a separate tutorial, we’ll focus on two features to use to thoroughly examine our site.
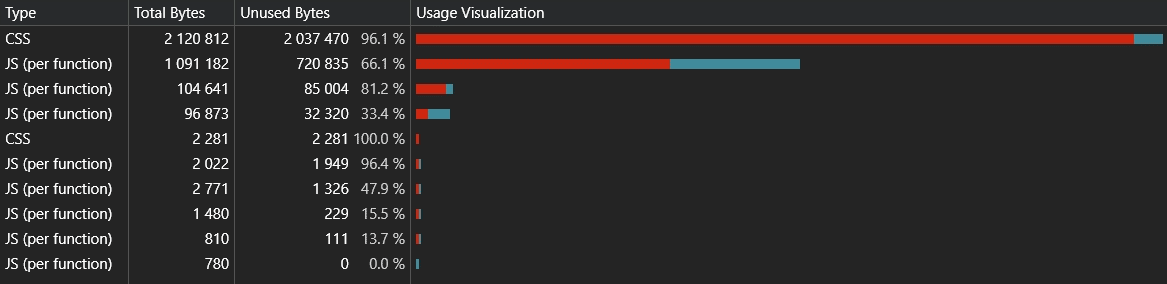
Wasted code analysis
.
The first is wasted code analysis. Clicking onoptions - More Tools - Coverage opens an additional panel, analyzing which code fragments were not used when rendering the page.
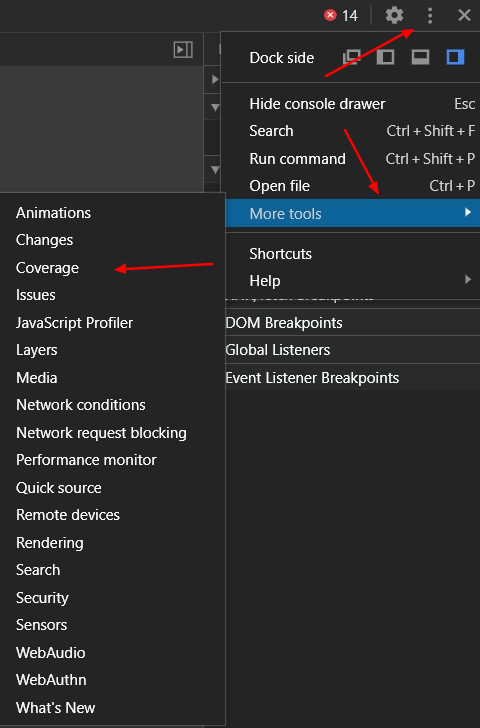
We get a simple summary of how much code has been realistically used and how much is wasted.
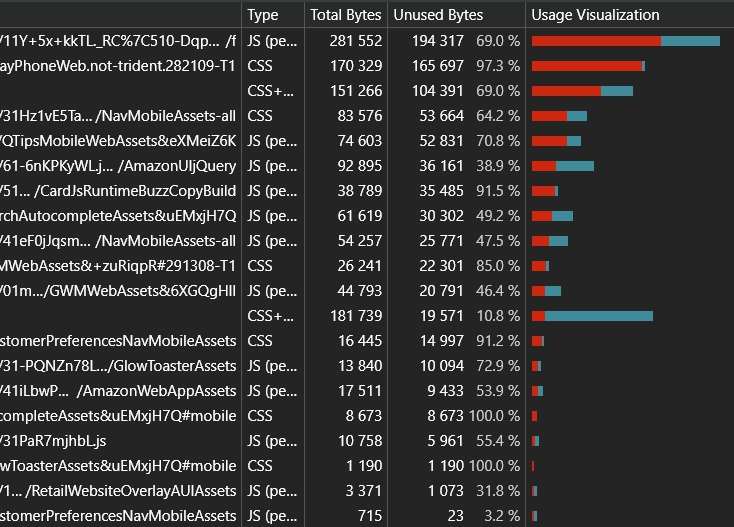
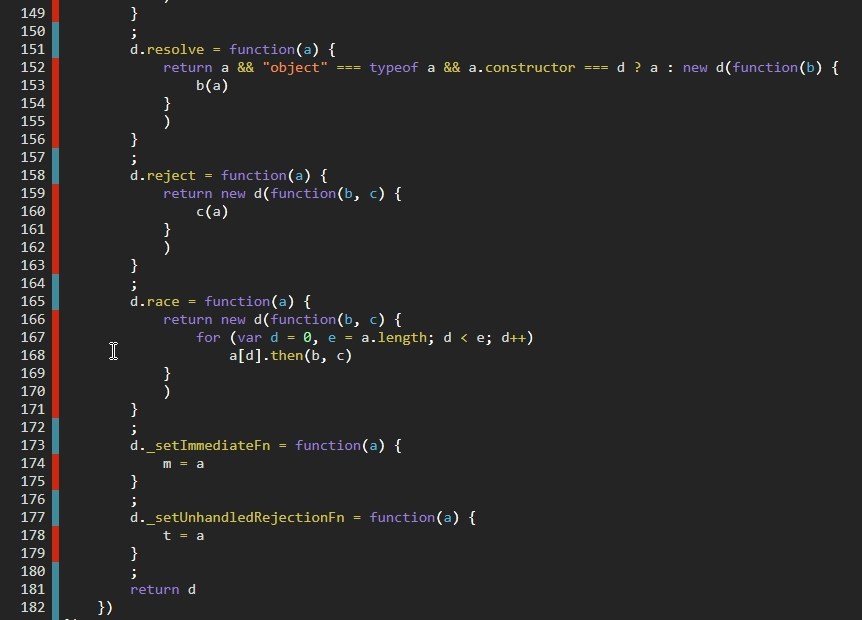
By clicking on any of the indicated Java Script or CSS files, we can see exactly which lines of code are unnecessary from the point of view of rendering a given subpage. Important: when eliminating redundant code, remember not to analyze just one subpage, but a group of them. A piece of code not used on subpage A may be crucial to the functionality of page B.
Performance Tab
.
Another extremely important feature of Chrome is the Performance tab -it is a key tool for analyzing Web Vitals..
When analyzing any sub-page of the site, a brief refresh and reload of the page by the browser takes place. Then we get all the answers we need: how long, to the nearest millisecond, it took to load specific elements, and which ones caused the problems.
On the timeline, we have exactly marked at which moments the template shift occurs, affecting CLS. We can tell which code fragments caused them and see them with our own eyes thanks to the automatic screenshot function.
Hovering over the Layout Shift marker highlights on the page the element that has been shifted. Clicking on this marker shows details about the shift.
One of the potentially problematic elements of Web Vitals is the Largest Contentful Paint - it can raise questions about what is really the key content element of my site in the eyes of Google. Again - just hover over the LCP tag on the timeline, and Chrome will highlight that portion of the page for us. And we know every millisecond when it loads. All this requires only a few clicks.
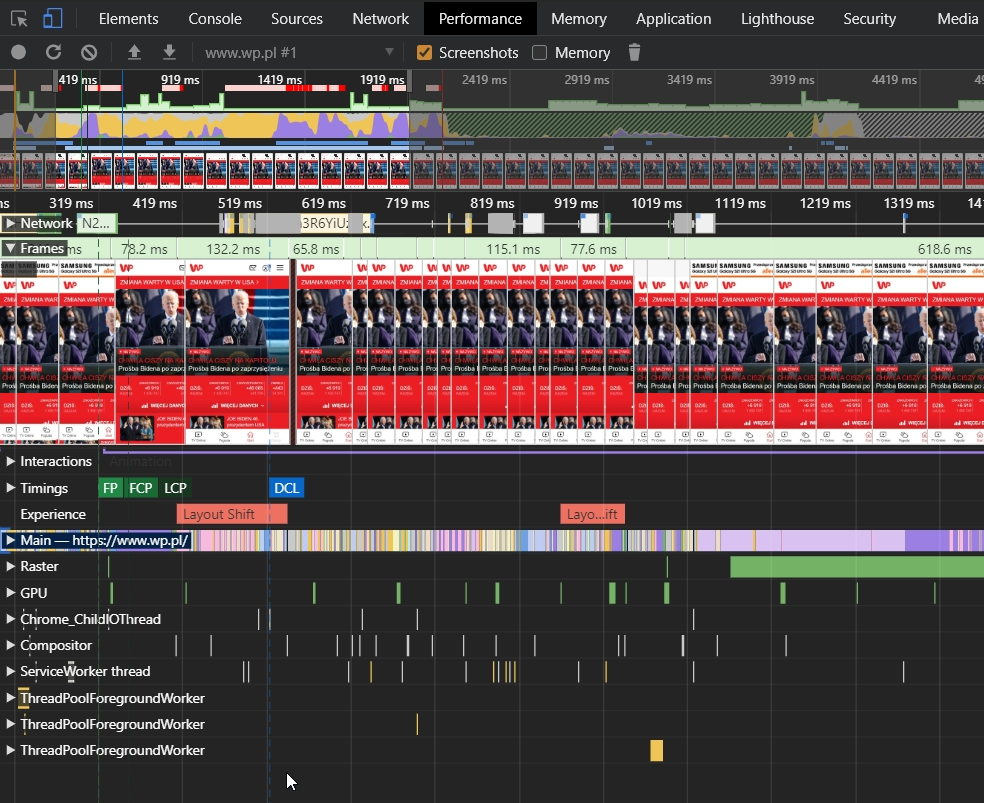
In addition, we have automatically highlighted in red all the steps and items that may affect the FID, as they represent so-called Long Tasks with an execution length of more than 50ms.

Should we be afraid? No - instead, we need to prepare ourselves and actively use the time we have left. The announced update is a move by Google in the right direction, and most importantly - nothing here is unclear. You are probably reading this article using a browser, which is the most powerful tool for understanding and fixing Web Vitals.

Robert Głowacki
Fan technicznego SEO i znajdowania nawet najgłębiej ukrytych błędów. W świecie SEO od 2007 roku. Obecnie Manager SEO w GroupM. Znajdziesz go naLinkedInie.
All articles →