What is bounce rate and how to reduce it?

Bounce rate is one of the most recognisable metrics, specific to Google Analytics and other similar platforms. Very useful in principle, but if poorly understood, can lead to wrong conclusions. What do you need to know about the bounce rate in order to consciously use this metric in reporting and evaluating the effectiveness of your site?
Bounce rate – what is it?
When discussing what the bounce rate is, it is worth mentioning that it is a component of dwell time.
The formula by which we calculate the bounce rate can be described as follows:Bounce Rate = Rejected Sessions÷All Sessions
Rejections are page entries that end up with the user leaving the site without any further interaction. This means that in such a session, the user meets at least one of the following conditions:
- Does not proceed further into the site, i.e. does not generate a second page view
- Does not perform an action tracked as an event in GA – this could be clicking on an element, scrolling or staying on the page for x amount of time
Let’s stop right at the second point, because it defines one of the traps one can fall into when trying to interpret bounces or their rate.
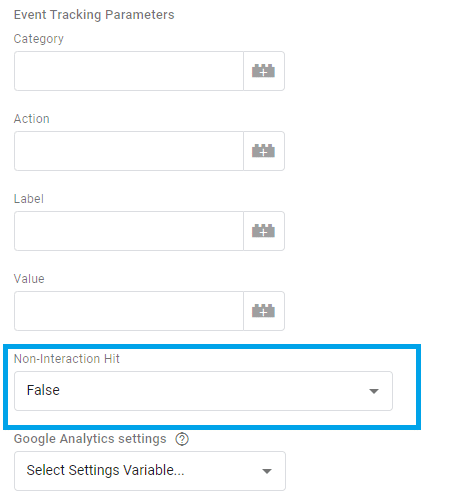
The scale of GA implementation affects the bounce rate – the more events measured by tracking code, the potentially lower the average values. This effect can be avoided by marking some of the events with the non-interaction parameter. It is worth using it if, for example, the interaction you want to track with an event takes place in parallel with a page view – e.g. the display of a banner.
If we send back such events using Google Tag Manager, nothing simpler – we just need to change the default option from “False” to “True”.
If implemented in the tracking code, we need to add a line of code. For Universal Analytics with analytics.js code, it is done like this:
ga(‘send’, ‘event’,‘category’, ‘action’, ‘label’, ‘value’,{‘nonInteraction’: 1})A dla kodu gtag.js następująco (podobną strukturę zaobserwujemy też w GA4)gtag(‘event’, ‘action’, {‘event_label’: ‘label’,‘event_category’: ‘category’,‘non_interaction’: true});
If we are not sure which version the page being analysed uses, we can check this by searching for the analytics.js and gtag.js libraries in the html code.
The use of non-interaction outlined above is a way of ensuring that the final bounce rate is only affected by events that actually require an additional action from the user.
However, this does not change the fact that if a complex Google Analytics implementation has taken place on the site, then comparing the bounce rate before and after it may turn out to be an apples to pears comparison.
This is not the only element, related to bounce rate, that can lead our conclusions astray. When analysing bounce rates, context is key – in other words, how they behave in the proximity of other metrics or dimensions.
Bounce rates – what should they be?
Let’s imagine some scenarios in which we discover that a website is recording a bounce rate of 80%:
- Homepage of an information service
- Product card in e-commerce
- Guidance article page
- FAQ page
Would we consider the value given above to be too high in each of these cases? Let’s break it down:
**1.The homepage should encourage the user to explore as much as possible, directing them to the points we care about. In this type of site, it represents a kind of catalogue of news that the visitor sees first – so with such a bounce rate result, it is worth considering to what extent the titles or images used encourage a click. Adding the average time on page to the analysis will show whether the homepage is not being treated a little like RSS, where you just scan the headlines for a quick look.
2. The product card in e-commerce** is designed to take the user (referring to Google’s customer journey diagram) from the ‘Think’ stage to the ‘Do’ stage – therefore, by means of an attractive presentation of the offer, directing them to a micro-conversion (adding a product to the basket) and then a main conversion (purchase).
We can further improve navigation on it by displaying breadcrumbs or product recommendations. If these types of cards on the site are experiencing high bounce rates, it is worth segmenting them more strongly to look for weaknesses. Maybe we need to enrich the pages of unavailable products or introduce a notification alert for a missing size, variant? For the purposes of such analyses, it is good to use the custom dimensions in Google Analytics – for example, we can send the availability status or delivery waiting time.
**3.In the case of a how-to article, our aim is often to move the user to the sales section of the website through internal linking, so, as a general rule, we expect the lowest possible bounce percentage here too. However, before we start thinking about how to optimise content pages, let’s look at what keywords you see content often being rejected for.
It is possible that the majority of visits come from long-tail phrases, with a strongly informative intent (e.g. What is optical fibre?).
If this is the case, the user simply realises the reason for their visit by reading the text and is no longer motivated to stay there. If, in addition, we refer the scroll percentage to GA and see that the article is actually read to the end, the increased bounce rate can be considered to be normal. However, it is still possible to work on it – even if only by introducing and testing boxes with suggested, similar content.
**4.The FAQ page has a simple purpose – to answer a user’s question. These types of sections, like the Contact or Returns Policy, can inflate the bounce rate of an entire page and this is normal – we do not expect them to drive the user “deeper”. If we therefore want to analyse this indicator, we can exclude them using the landing page dimension in the Google Analytics tables.
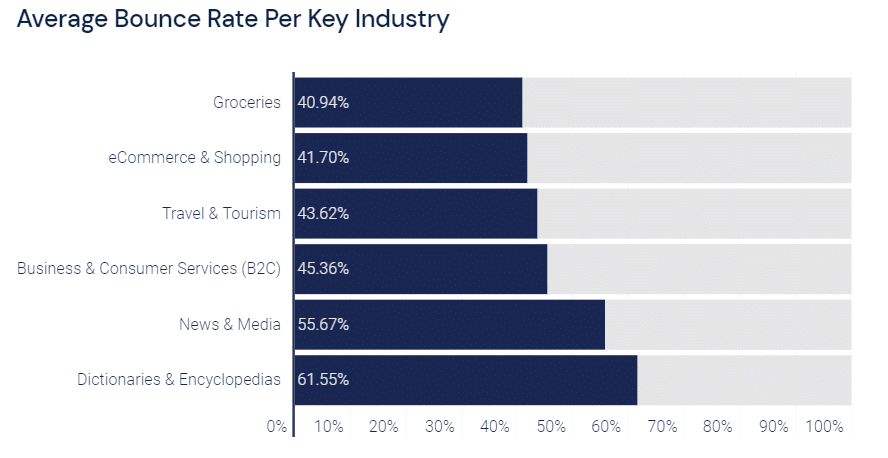
What conclusion can be drawn from this? Bounce rate is an indicator that needs to be analysed in the context of the purpose of each sub-page, preferably in combination with other metrics. I am sometimes asked whether the global value of a particular service is high or low – unfortunately, the answer to such a question is always: it depends. The studies available on the web and the suggested results are worth considering only as inspiration.
How to reduce the bounce rate?
Let’s assume that we have already drawn conclusions about bounce rates on the site and broken them down in the manner discussed above. In addition, it is worthwhile to:
1. Separate out mobile and desktop traffic – while mobile used to be a weak point from a session quality metrics perspective, it is now the desktop that is sometimes neglected by e-businesses. Choosing a weaker version will tell us which one we should take special care of in the area of speed or a/b testing. In the performance area, we can use Lighthouse or Webpagetest.org, among others, and the free Google Optimize for testing.
2. Break down the bounce rate analysis by traffic source – above we talked about keywords, which can drive a relatively distant user from a purchase decision to the site, but the different channels also have similar characteristics. And yes, if you are running remarketing campaigns for returning users, they should record a significantly lower bounce rate than google / organic targeting for articles.
If, in addition, many rejections are recorded by campaigns that present the user with what he or she has already viewed, we should definitely make sure that the targeting rules are correct.
Another legitimate step is also to incorporate qualitative analytics tools – Hotjar, Yandex Metrica or cux.io can collect heatmaps and session recordings to better understand the user path, also, for conversion optimisation.
If we want to broaden the spectrum of analytics a bit in terms of overall improvement of potential customer engagement, we might consider adding custom time tracking to the site. A bounced session is, as a reminder, one that ends without the user moving deeper into the service.
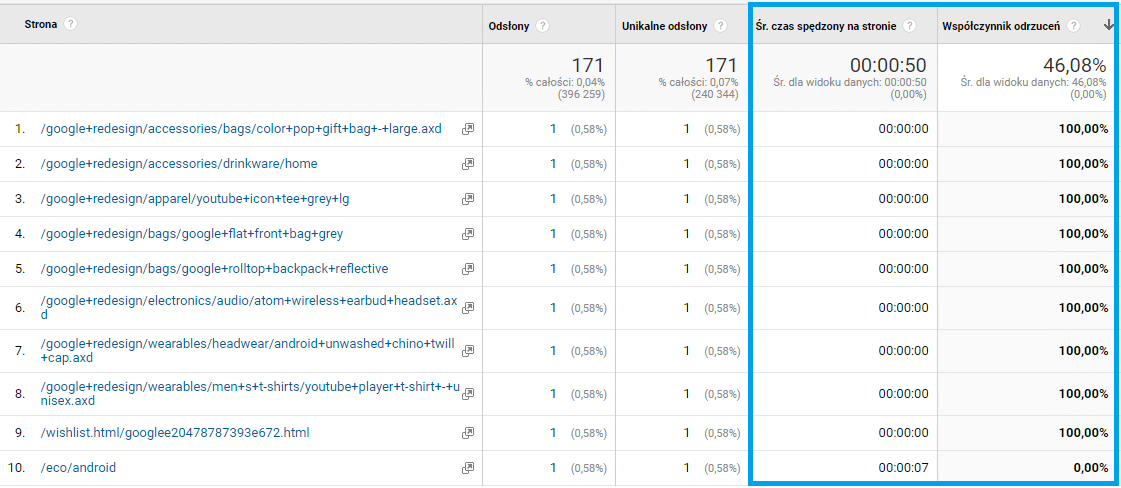
It is worth remembering that the ‘Average time spent on page’ metric available in Google Analytics is calculated from page view to page view – so sessions with a bounce rate of 100% have a concurrent time of 0 seconds, as can be seen in the following screen shot from Google’s demo account.
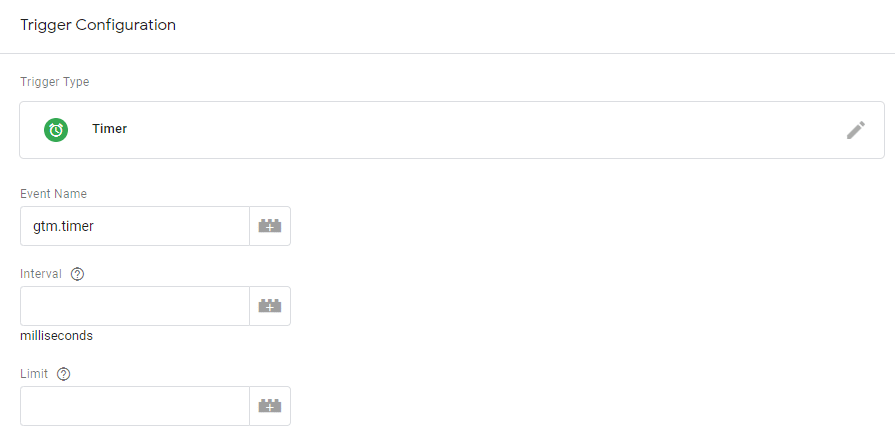
We can bypass this limitation by sending our own non-interaction events measuring time on each page, including abandoned pages. The easiest way to do this is in Google Tag Manager, where a special rule called “Timer” is available – simply select the intervals you are interested in and, if you wish, set a limit.
An additional option to extend the analytics of bounced sessions or pages is to implement the aforementioned scroll tracking – I described it in more detail in the article , “Google Analytics – how to configure and what to check”.
To summarise, the bounce rate is a metric designed to measure what percentage of sessions on a site end up leaving the site without any interaction, which pages and which traffic sources perform better and worse in this respect. This will be most useful when we compare it with other indicators such as time on page, page load time or scroll depth. The more we look in depth, i.e. at bounces, precisely in the context of landing pages or individual campaigns, the more conclusions we can draw to optimise user engagement.

Aleksandra Lisiecka-Lenart
Od 2011 roku związana z marketingiem internetowym dla branży e-commerce. W Bluerank od 2014 roku, zajmowała się m.in. analizą skuteczności stron oraz wdrożeniami narzędzi analitycznych. Aktualnie wspiera dział SEO w budowaniu podejścia data-driven, w tym badaniu skuteczności contentu i aktywnym wykorzystywaniu autorskich narzędzi reWrite oraz BlueAttribution. Prelegentka podczas konferencji branżowych, od 2017 roku wykładowca Społecznej Akademii Nauk, prowadząca zajęcia z obszaru analityki dla e-commerce. Prywatnie miłośniczka kotów, książek i gier strategicznych.
All articles →