Google Sheets - how to win with Google's algorithm thanks to them?

Google Sheets (or otherwise: Google Sheets) - how to analyze SEO statistics with them? Agata Koptewicz of Fly On The Cloud has prepared a handful of tips on how to use services from Google in the SEO process.
Do you know the three pillars of successful SEO on Google? It’s knowledge of the search engine’s algorithm, proficiency with specialized tools and skillful optimization of content in accordance with the results of analysis. If you master them all, even the most beleaguered “one” on the search engine results page (SERP) will no longer be unattainable.
Panda, Penguin and Hummingbird
.
If you ask an SEO specialist what his or her favorite animal is, he or she will probably choose Panda, Penguin or Hummingbird. What could monochromatic bears, the world’s smallest birds and the most cold-weathered nonlots have in common? Google. These are the symbolic three main guardians of quality on the search results pages of the world’s most popular search engine:
- Panda defends Internet users from worthless content, .- Penguin makes sure that practices such as accumulating spammy links and flooding pages with keywords don’t get away from anyone, .- A Coliber is a faithful assistant that guesses the intent behind users’ queries and links them to the most relevant results in the blink of an eye. .
Google’s algorithm is not easy to outsmart, and each successive update brings it dangerously close to perfection. Resisting it is of no use and has long been considered a faux-pas in the SEO community. The era of cheap tricks to boost rankings on SERPs is over, benefiting not only all users, but also owners of valuable sites.
Now that abuse has gone out of fashion, how can we fight Google’s algorithm for higher rankings? We must honestly take part in the quality race.
There is no shortage of tools to help us do so. In this age of social isolation, we encourage you to use the ones that enable the most convenient online collaboration, namely Google apps.
Google apps privately and for business
.
The list of products and services that Google provides us via the Internet is so extensive that the vast majority of employees of this technological corporation would have difficulty recalling them all. Therefore, it is worth specifying that by “Google Apps” we mean the set of file editors and communication tools linked to a Gmail account. Professional users know them by the collective name G Suite.
What is G Suite?
.
G Suite (and formerly Google Apps for Work) is a business email and cloud suite of programs that includes Sheets, Documents, Presentations, Websites and more.
Since we can log in to most of these tools using a free Gmail account, why pay for G Suite? Here are the top 3 reasons why companies leave private Gmail to private users and equip their employees with professional accounts:
- Higher levels of collaboration - G Suite is a machine for maximizing employees’ collective productivity. The apps can be accessed from any mobile device, and each is equipped with a range of features for specialized collaboration within a single file.
- Data security - threat alerts, encryption, password strength monitoring, advanced app configuration and an overview of all connected mobile devices are just some of the G Suite features that will help defend your company’s data from cyber attacks.
- Control of the organization’s processes - all applications for daily work and communication in the office can be managed remotely from a single administration console.
How to analyze SEO statistics in Google Sheets?
.
We already know the three most famous Google algorithm updates and basic information about the G Suite service, which includes Google Sheets. It is time to combine these two areas of knowledge.
We present examples of how Google Sheets can be used to fight the competition and the Google algorithm for podium spots.
Get rid of duplicates
.
In order to nimbly leap over the logs that Panda throws at our feet on our way to the top of the SERPs, we need to make sure that the content of the pages is as valuable as possible. We will use Google Sheets in planning and optimizing the content.
The first and most important thing we need to do is block indexing of sub-pages that contain low-quality content. Texts that put your site at risk of receiving penalties from Panda are:
- Duplicate articles, multiple discussions of similar topics, and texts that rank for nearly identical keywords (also check: keyword calibration).
- Short articles that do not exhaust the topic, thus leaving the reader with a feeling of inadequacy and wasted time. .- Background or preclassified content mass-produced and published without attention to detail.
- Texts that contain errors in style, spelling or content. .
Problems with quality and duplicate content most often affect online stores that have separate subpages for each variant of similar products. To avoid having your ranking lowered by duplicates, take care to designate canonical links that will index first.
Analyze your content successfully in Google Sheets. The file exported from Google Analytics in any format (e.g. xls, csw, xlt, or xml), you can easily open in Google Sheets. Just add it to Google Drive and click “open with Google Sheets.” The advantage of web applications is that you only need the Internet and a browser to use them. You don’t need to install local programs and litter your hard drive with files.
We can process the data loaded into the worksheet tables from an external source.
Check if the content of sub-pages with similar keyword is clearly different from each other. If not, consider indexing the worse article.
In addition, you can use the following functions to get the data you are interested in without leaving the Spreadsheet.
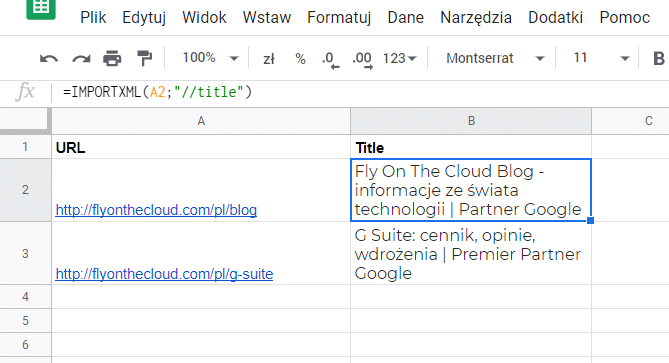
Formula =IMPORTXML(“full_address_page”, “//a/@href”).
IMPORTXML looks for metadata on the selected page and copies it to the spreadsheet. It allows you to create a comprehensive map of all meta titles and meta descriptions from your site for further analysis later.
Additional variations of this formula, are:
-
- ”//@href” - pulls all links from the site (internal and external) into one column.
- “//a[contains(@href, ‘address_page’)]/@href” - shows only internal links, so it’s easier to assess how well the site’s subpages are connected to each other. .- “//a[not(contains(@href, ‘address_page’))]/@href” - shows external links, The number and quality of outgoing links should be monitored from time to time, and this feature helps to extract them. .- “//meta[@name=‘description’]/@content” - finds meta descriptions. With this, we can correct the length and compare the quality of all the descriptions a user will see on the SERP. .- “//h1” - finds headings marked as H1. Reviewing all the main headings in one place will help you assess whether they contain keywords relevant to the content of the subpages. .- “//a[contains(@href, ‘mailTo:’) or contains(@href, ‘mailto:’)]/@href” - finds email addresses posted on the page - an easy way to gather a lot of contact information at once without a manual search.
- “//title” - finds the meta title for the given web address - this allows us to analyze it in a later step, e.g. for the number of characters. .
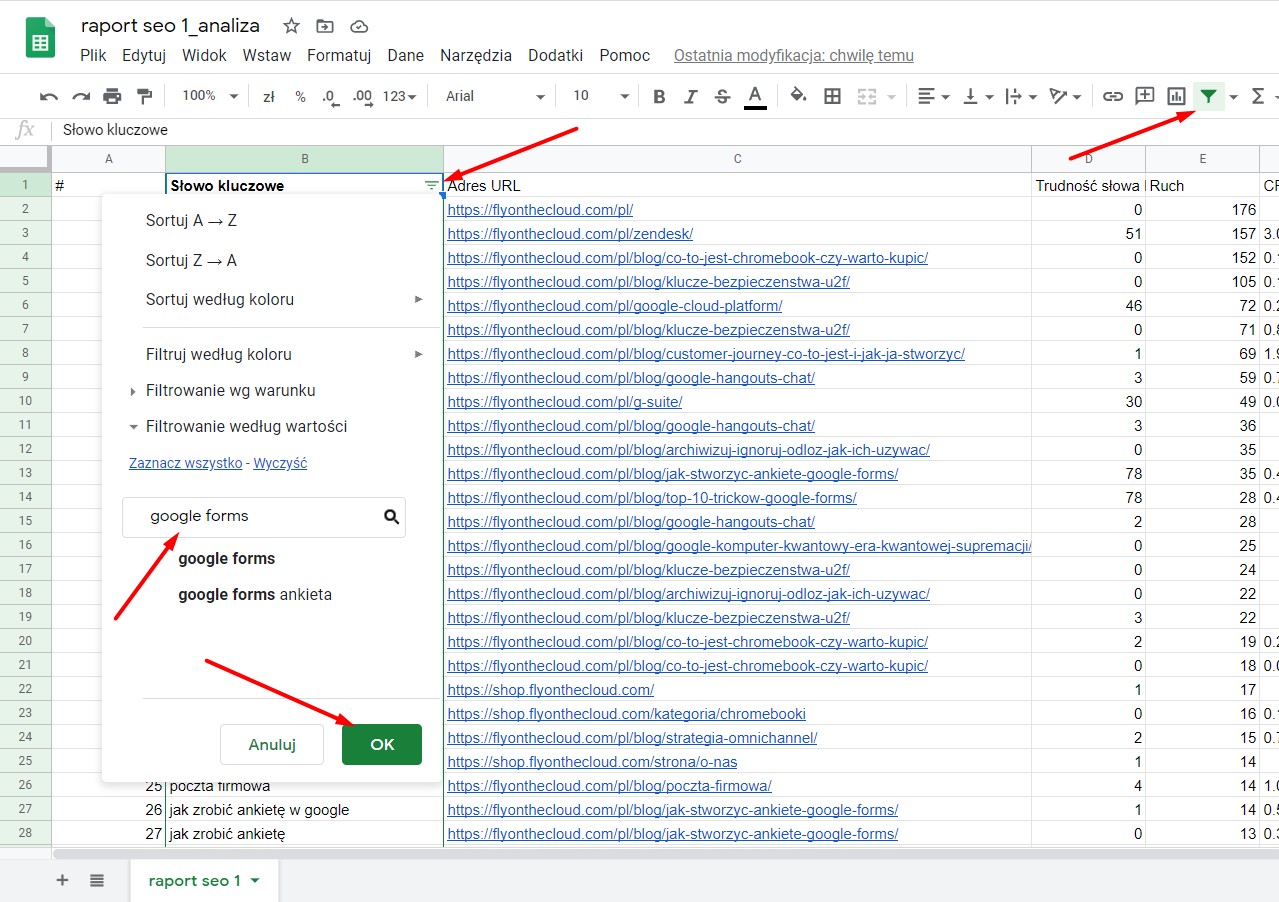
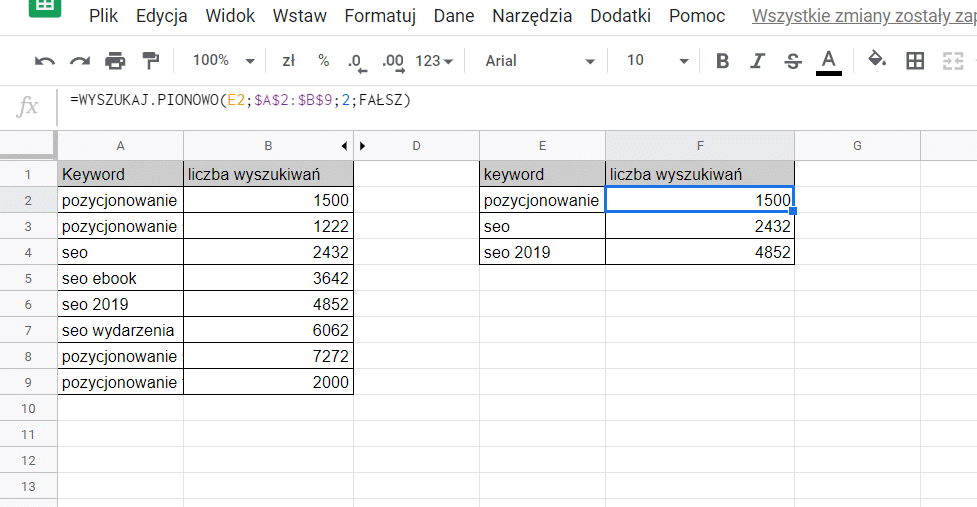
Formula =SEARCH.VERTICAL(keyword;range;Index of column with value to be returned; FALSE).
SEARCH.VERTICAL is a formula that searches selected columns for the presence of specific keywords. It comes in handy especially in voluminous worksheets to which we have previously imported data from external analysis tools.
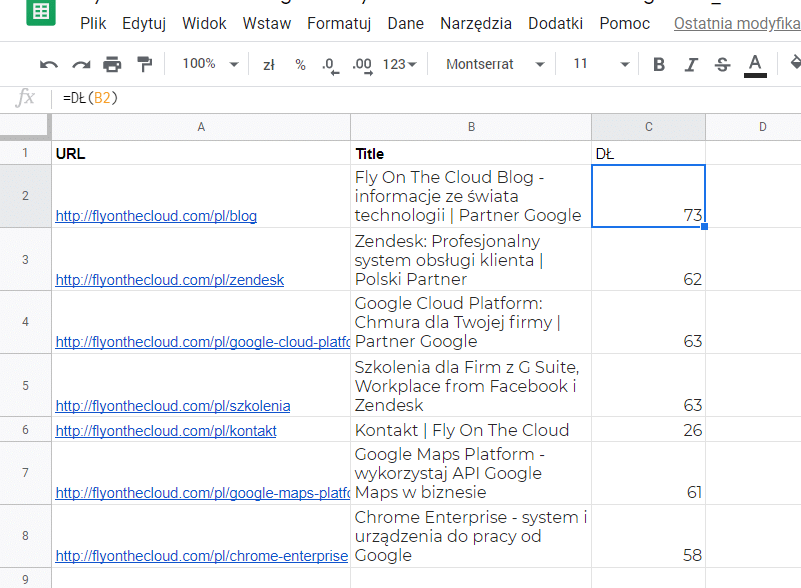
Formula =D³(range).
D³ (short for length) will count the characters in the contents of the selected cell for us. This procedure is especially often used when checking the volume of meta descriptions and meta titles.
 .
.
Tip:.
Even when the number of characters in the title is appropriate, it’s a good idea to check the number of capital letters as well. Versials take up more space than minuscules, making our title look unsightly despite the seemingly right number of characters!
Formula to import data between worksheets =IMPORTRANGE(“address_url_sheet_calculation”; “NameSheet!range”).
The work of an SEO specialist is based on the use of various tools, so there will be several or a dozen data sources. How then to keep things in order? For this purpose, it is worthwhile to create one main sheet-dashboard, where the data will automatically go.
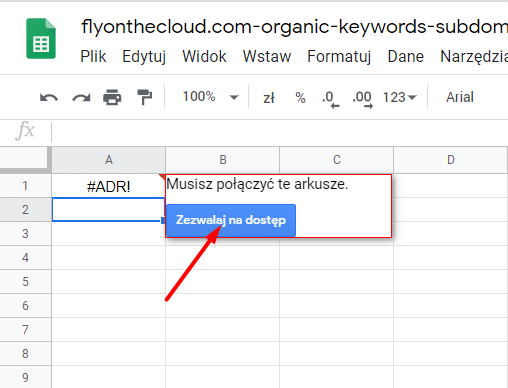
Example of using the formula: =IMPORTRANGE(“https://docs.google.com/spreadsheets/d/1SdwPegd2b8XMCesHGKcY1RpcIeg37\_9orF-Mb0LX2WY”; “Sheet1!A1:A11″)
If you get a #ADR message after running this function, allow one sheet to access another. From now on, the data will transfer automatically whenever there are any changes in the cell range we selected.
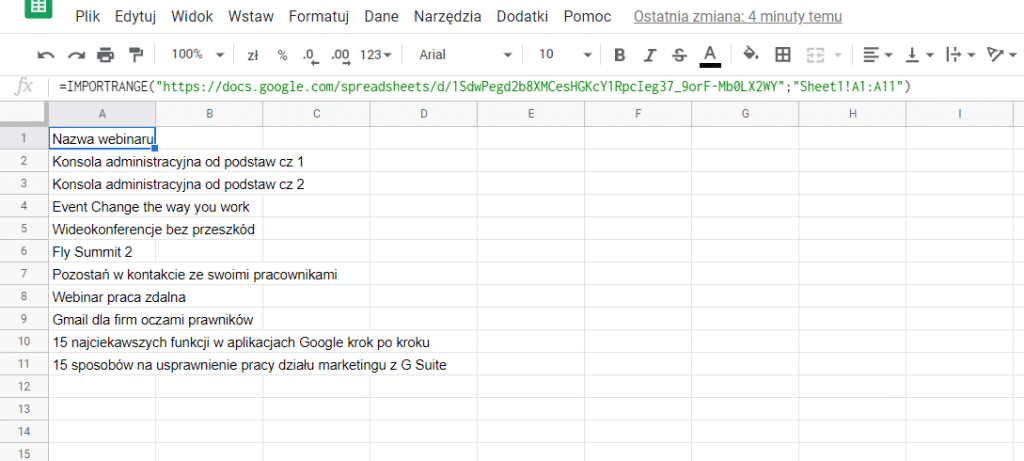
Below is an example of importing titles from the webinar schedule. If someone makes corrections to the source file, this sheet will update right away.
Export files from Google Search Console to Google Sheets
.
Some of the functions listed above are of no use if you don’t first create a database that can be computed. Compiling such a database can take from a few minutes to several hours - depending on whether you copy selected information manually or export it in bulk from analytical tools. Of course, in most cases the second way will work better.
To export data from Google Search Console to a sheet in seconds, we first go to the “Performance” tab. The first thing that will catch our eye are the graphs, which will give an overall view of the site’s performance. If we want to see detailed information, we have to scroll the screen all the way to the bottom table.
Here we can filter the basic statistics (i.e. clicks, views, average click-through rate and average position) using:
- Search queries - all search terms that show results with your site.
- Pages - we can display the performance results of a specific sub-page. .- Countries - we can select the location from which the queries that lead visitors to your site originate.
- Devices - we can see performance by the type of devices used for browsing.
- Image - we can select visual elements, (such as accelerated mobile performance or code snippets) .- Date - allows us to select queries that occurred on a specific day. .
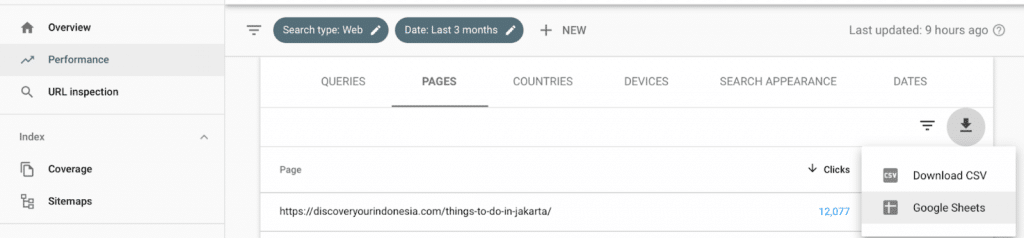
To export data from a selected category, we click on one of the table filters - such as Countries. The button with the down arrow icon develops a list of export options - we can choose a universal CSV file or export directly to Google Sheets. If we click the second option, a Google Sheets file will open in a new window, containing a copy of the basic statistics from Search Console by country.
Based on the data exported by this method from Search Console, we can perform advanced operations using all the functions available in Google Sheets.
For example, it is worth applying Conditional Formatting to the table of queries whose results show your site in positions from 1 to 20. Then the high and low results on the selected scale will be visually distinguished. We can apply green to the range of satisfactory page positions, and red to those for improvement. This will make it easier to find, for example:
- Queries that should become keywords in the following texts, i.e. lines with red color. .- Well-positioned pages whose meta descriptions are unattractive to readers - those that have a low click-through rate despite the green color. .- Content in which keyword saturation is too low - red results that have plenty of impressions but a low click-through rate.
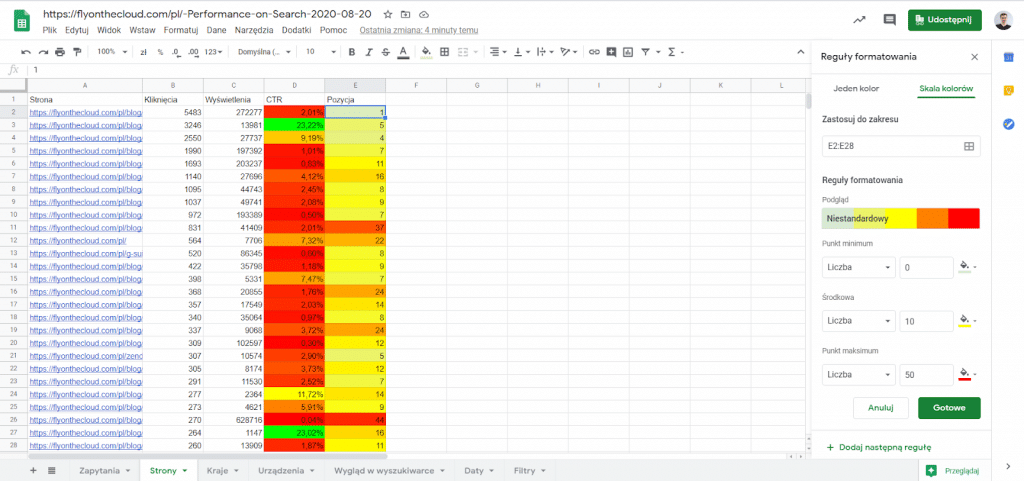
By optimizing content based on such a table, you’ll help potential customers (i.e., those typing in queries that betray purchase intent) reach the content they’re looking for, and ultimately drive your sales. In addition, you’ll gain “favor” from the algorithm features that Hummingbird is responsible for - so your pages will soon jump noticeably higher in the SERPs.
The possibilities of calculating and analyzing data on the basis of selected criteria are limited only by the analyst’s imagination. If you’d like to learn an additional 101 tricks in Google Sheets that will make you a master calculator, apply for the free ebook.
Web site status monitoring worksheet
.
Without a well-functioning website, any operation to increase its visibility makes no sense at all. That’s why we encourage you to monitor the status of your website using Google Sheets. How to do it?
To do so, just run the prepared script in the template of this spreadsheet: https://docs.google.com/spreadsheets/d/1XkLfUaVOOc_WtEvPr5j1ujgAwugl72iqRki7toDKPVA/copy.
Make a copy of the file to your own drive so you can edit it. Follow the steps described in the instructions to successively receive information about whether the page is unavailable - that is, when the formula returns a code other than 200. You will get the next notification when the page returns “to the living”.

Integrating Senuto with Google Sheets
.
Did you know that recently you can connect Senuto with Google Sheets to make all your SEO activities even easier?
You can find instructions for installing the add-on and examples of how to use its features in your daily work in a separate article on our blog:

Agata Koptewicz
Content Manager we Fly On The Cloud. Służbowo tworzy treści, które uczą, bawią i sprzedają, a hobbystycznie uprawia słowną ekwilibrystykę na granicy dobrego smaku. Prywatnie pełni rolę przewodnika stada dobermanów i uważnie śledzi technologiczne nowiny.
All articles →