How to quickly retrieve data from Google search and Google Analytics in R?

In this article, we’ll look at pulling data from the most important tools from Google’s stable for any SEO - Google Analytics (also in its latest i.e. v4) and Google Search Console. We will start with the numbers that are necessary for us on a daily basis. In addition, we will use ready-made and free tools, which are the libraries: searchConsoleR and googleAnalyticsR.
.
From this article you will learn:
-
How to install the necessary libraries?
.
-
How not to install libraries you already have? .- How to download data from Google Analytics (including its latest version - v4)? .- How to collect data from the Google Webmaster Tools panel? .- How to get started with the APIs provided by Google? .
After reading the previous post, you already remember (if you don’t, I invite you to read - R programming language for every SEO. Position, program and watch the results):
-
What R is and how it will help you in your work
.
-
What are the libraries in R (and why you need them)
- .
We get data from Google Search Console
.
In order to use the library in R, we need to install it (you can bypass this, but I recommend installing it) and load it into memory (exactly in that order). The installation process in most cases takes up to a dozen seconds. Even so, in the code below, we will first check if you don’t already have the libraries we are interested in. If so, we’ll go straight to step two, which is to load the selected library into the computer’s operating memory.
Step 1. The following code writes the name of the library we need as a vector (data type guide in R: https://towardsdatascience.com/data-types-in-r-8124c3b2afe6):
packages <- c("searchConsoleR"," googleAnalyticsR").
code 1.1
Step 2. Check if the necessary libraries are installed on your computer (if any of the necessary libraries is not installed, it is installed)
install.packages(setdiff(packages, rownames(installed.packages())))code 1.2
Step 3. Authorization. This is self-explanatory, but it’s worth reminding you that this way we will only have access to site data that is available in our Search Console account.
We do this by using one simple command:
scr_auth().
code 1.3
The code for steps 1, 2 and 3 is available here..
The next steps depend on whether it is the first time on a particular computer to retrieve data using this library.
The first time is when the Google account login window opens in the browser. The GSC tool uses authentication via the oAuth protocol. As a result, you will see the standard Google**.** login window.

After successfully logging in, you still need to agree to allow the Search Console application to access your Google account.
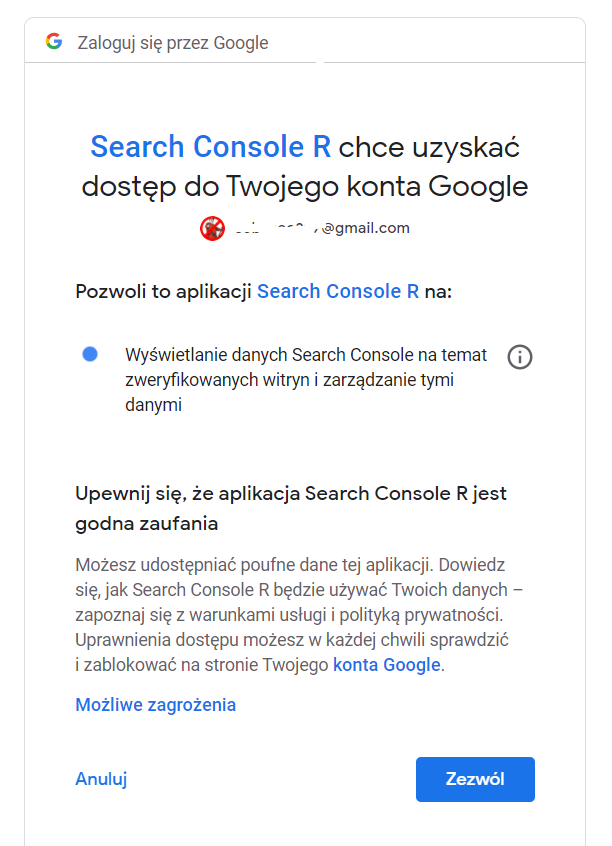
Such a request takes place only during the first login on a given device. During it, a JSON file containing the login data is created. Thanks to this, subsequent logins occur much faster (R already downloads the login data stored in the JSON file).
From this point on, we have full access to functions related to:
-
Pages added to the panel (downloading a list of all, adding a page to the panel, removing a page from the panel) .- Site maps (retrieve list of all, add to site panel, remove from site panel)
.
-
Errors reported in the panel (download examples of errors reported in the panel, download examples of URLs containing reported errors)
-
Visibility of our sites in Google (we can see this data in dimensions):
-
date - here we get information for what day we get the data
-
country - data on the geographical location of the user who saw your site in the search results
-
device type - on what type of device in Google results the display occurred (available values are Desktop, Mobile, Tablet)
-
page - a subpage of the website that appears in the search results
-
the searched phrase - the phrase, after searching for which, the site was found in Google
-
interestingly, none of the dimensions is necessary (then we get the total data).
The search_analytics function, which we are about to use, takes parameters such as:
-
address URL (necessary parameter)
.
-
start date - the date from which you want to retrieve data (if you set a date for which there is no data in the panel, simply empty rows will be returned) .- end date - the date to which you want to download data
-
type of search results, values available:
-
“web” - standard search results
-
“image” - graphical search results
-
“video” - Google search results in video
-
walk_data - a parameter specifying how we want to retrieve data. It takes one of the values:
-
byBatch - this option works much faster, but it only returns results for which the analyzed page has received clicks (i.e., it’s not a good idea if you want to check how many hits a page has received on Google - all the hits without clicks will be removed)
-
byDate - as you already know, this method is more accurate, but requires more time (it took me about an hour to retrieve information about 10 million Google impressions). The limitation imposed on the API is that it can retrieve up to 25,000 rows at a time. Fortunately, for those who want more data, an option is provided to queue up 25,000 rows at a time and combine the data so collected.
How to deal with the limitations of GSC?
.
The described library retrieves data using API GSC, so we can bypass the standard limitation of the GSC panel allowing us to retrieve up to 1,000 rows in a report. The batching option allows us to download all the data. As I described, such data is downloaded in batches of up to 25,000 rows.
When downloading data from GSC, we have to reckon with the possibility of losing some of the data. This is because, as Google explains, the system tries to return the results in an acceptable time. It follows that with poorly constructed queries (involving too many Google resources at one time), some data may be lost.
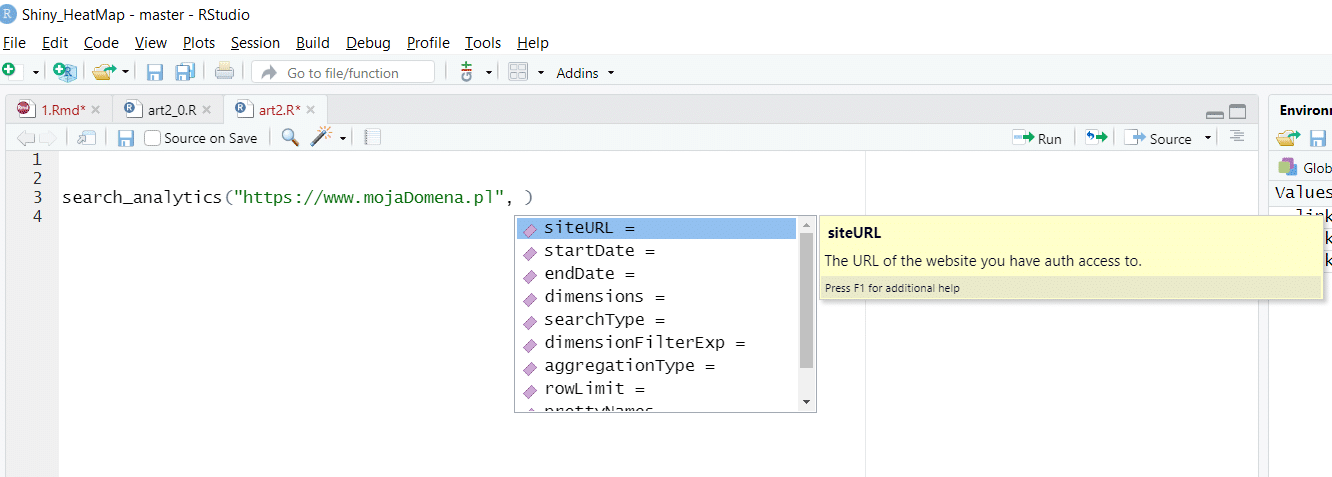
With the above knowledge, we can perform the first full query of GSC data..
Hinting: One of Rstudio’s strong features is automatic code hinting. As you can see below, this is very helpful when working with the searchconsoler library.
How to download really large amounts of data (more than a million rows) from Google Search Console?
.
Downloading such an amount of data requires:
-
Using the API (the GSC interface has a limitation of 1,000 records in the report - actually the first 1,000 records, which means, for example, you will see only the most popular phrases)
- .
- Applying the batching option in gscR (already described above) .
-
Batching the data - it takes about 30 minutes to download about 1.5 million records. With much larger numbers, we may even need several days to download all the data! The solution to this problem is to use the dimensionFilterExp parameter.
The content of this parameter consists of a filter and an operator.

The filter can take one of the values:
- Country
- Device
- Page
- Query
The available operators are:
- ~~ (meaning contains) .- ==(meaning equal) .- !~(meaning does not contain) .- != (meaning not equal) .
Filtering ideas:
-
All traffic from selected devices
.
-
All traffic to selected sub-pages (e.g., just the home page)
-
All traffic from the selected country (e.g., traffic from Poland only)
- .
Filters, importantly, can be combined. Examples of compound filters include:
-
All traffic from a selected device type to a selected subpage
.
-
All traffic from users from a selected country for phrases containing a specific element
The entire script, ready to be copied and run, is available there..
How to quickly download data from Google Analytics (also v4 version) in R?
.
Step 1. As in the previous script, we write down the name of the library we need.
packages <- c(" googleAnalyticsR").
Step 2. Just as I have already described with Google Search Console, we check if the needed library is installed on your computer.
install.packages(setdiff(packages, rownames(installed.packages()))).
Beginning to work with Google’s API in earnest (sign up for a Google Cloud Platform account)
.
Wanting to work seriously with the APIs provided by Google, we should create an account.
Step 3. In this step, we will create an account in Google Cloud Platform. This is necessary to be able to take full advantage of the API capabilities for Google Analytics. Our goal will be to obtain:
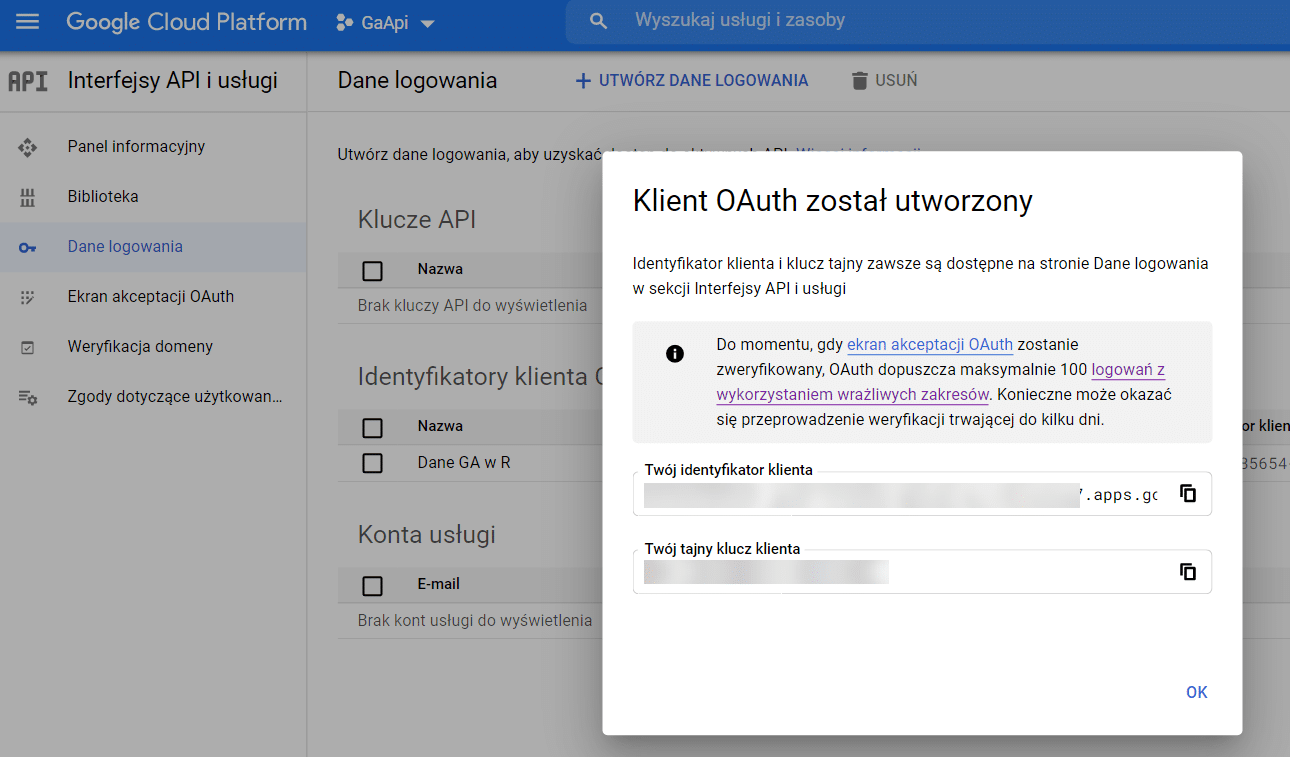
- client secret (a string available in a file we download from GCP) .- client ID (GCP user ID) .
To do this, we need to:
-
Create a free account on the GCP website (I won’t explain this)
.
-
Enable Google analytics API support on your GCP account.
- .
To do this, select the APIs and services menu.
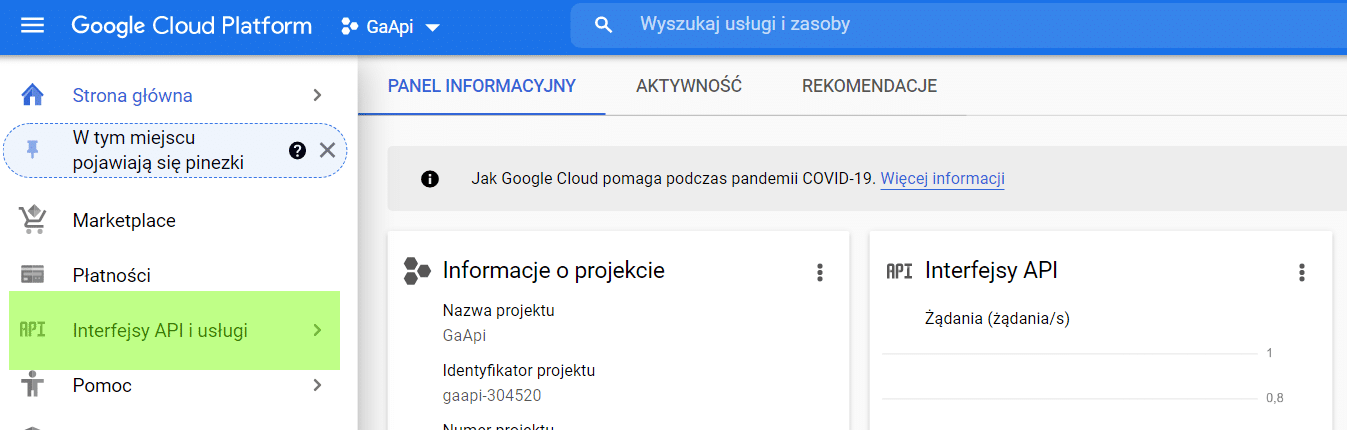 .
.
Go to Enable APIs and Services.
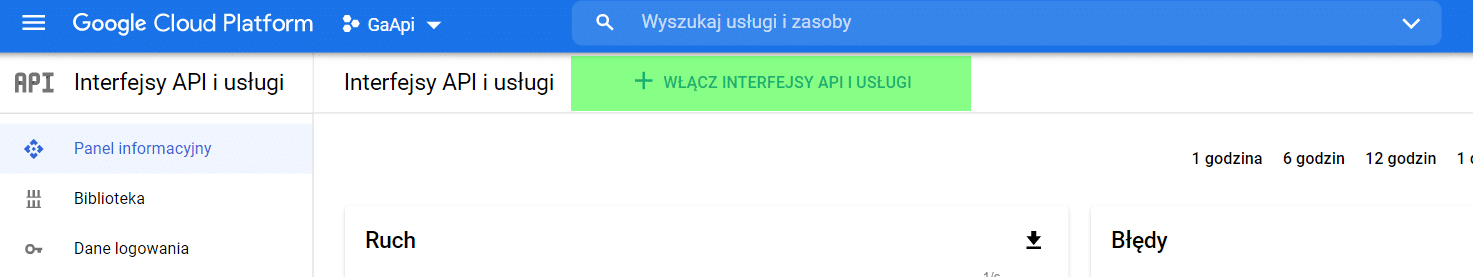
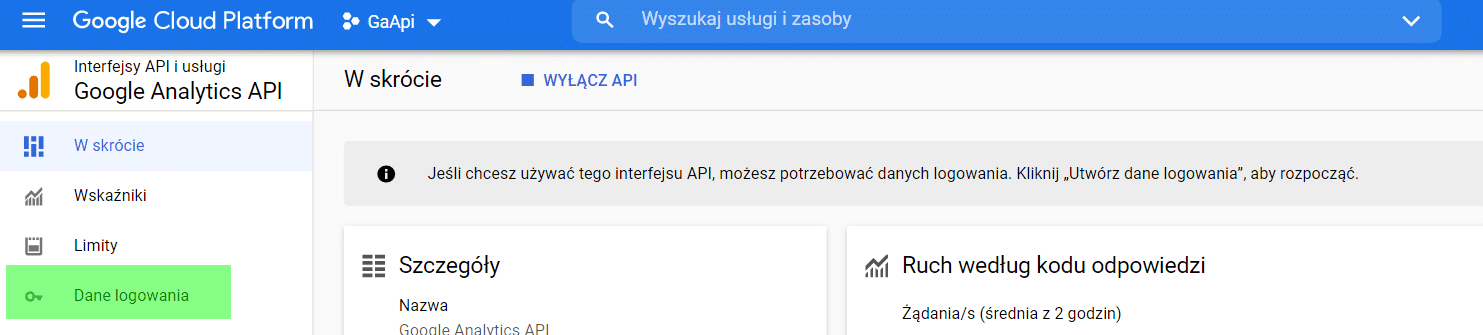
From among the available ones, we choose the following API.

Next, from the menu, select Login Details.
 .
.
When asked about the type of application, we select “Computer application”.
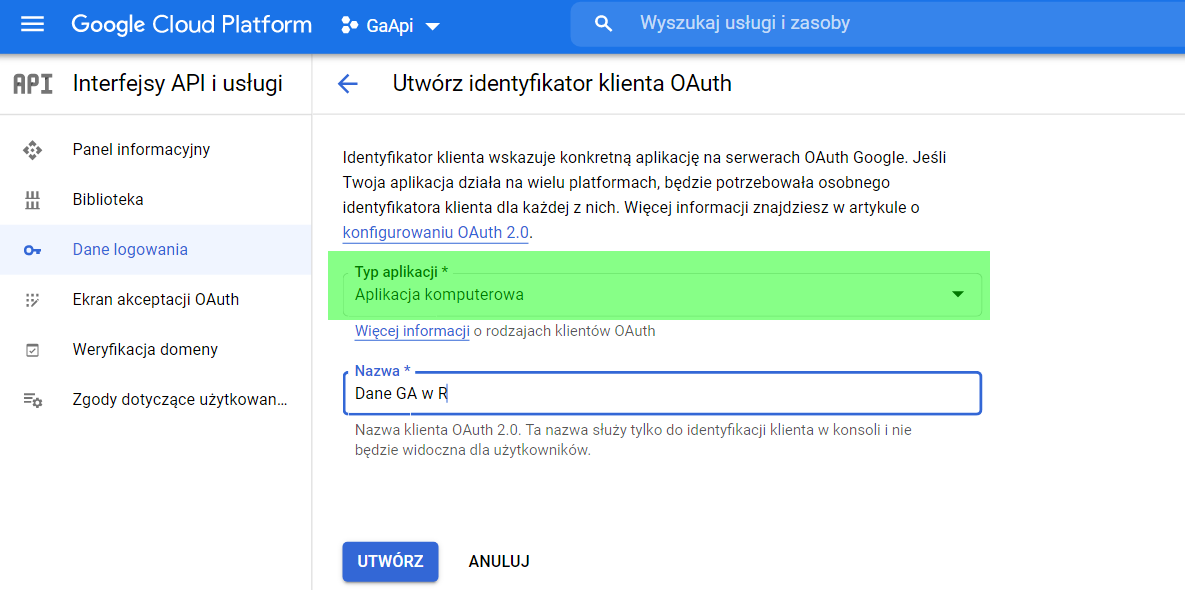
After completing the name and type of application, we get the ID and secret key for our account.
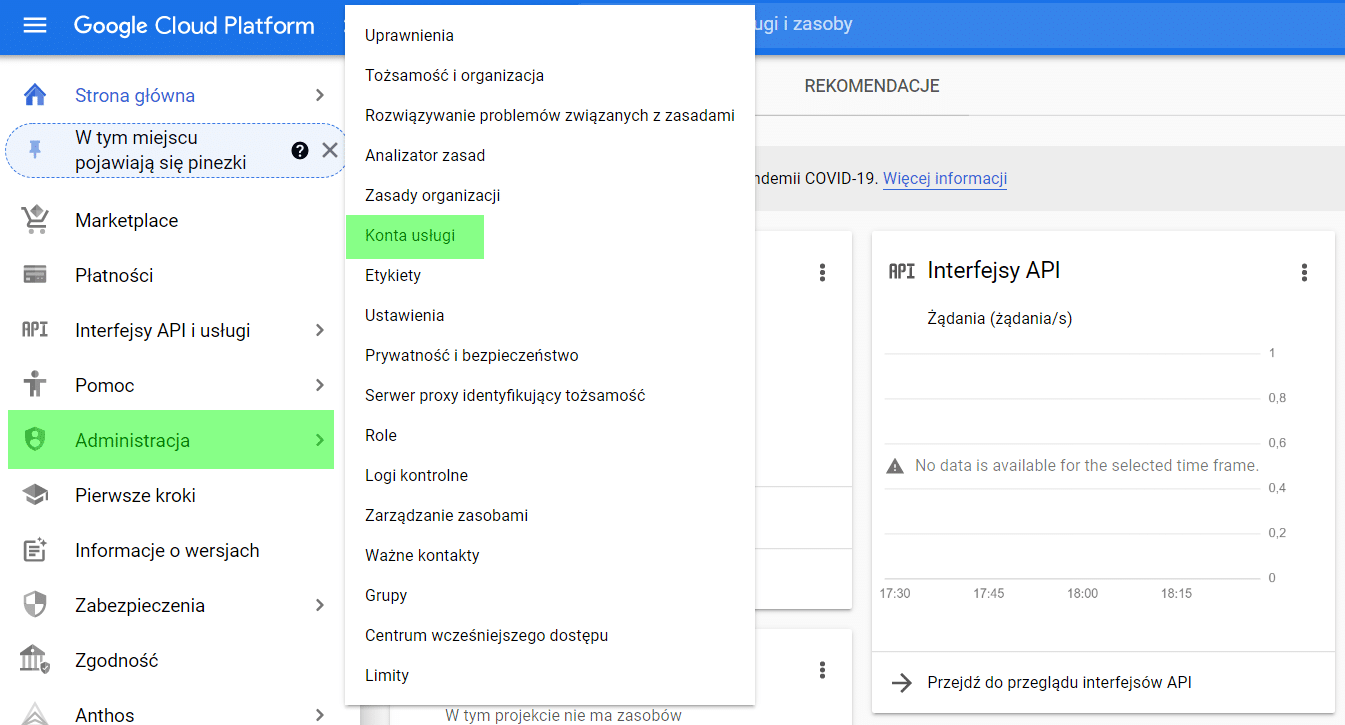
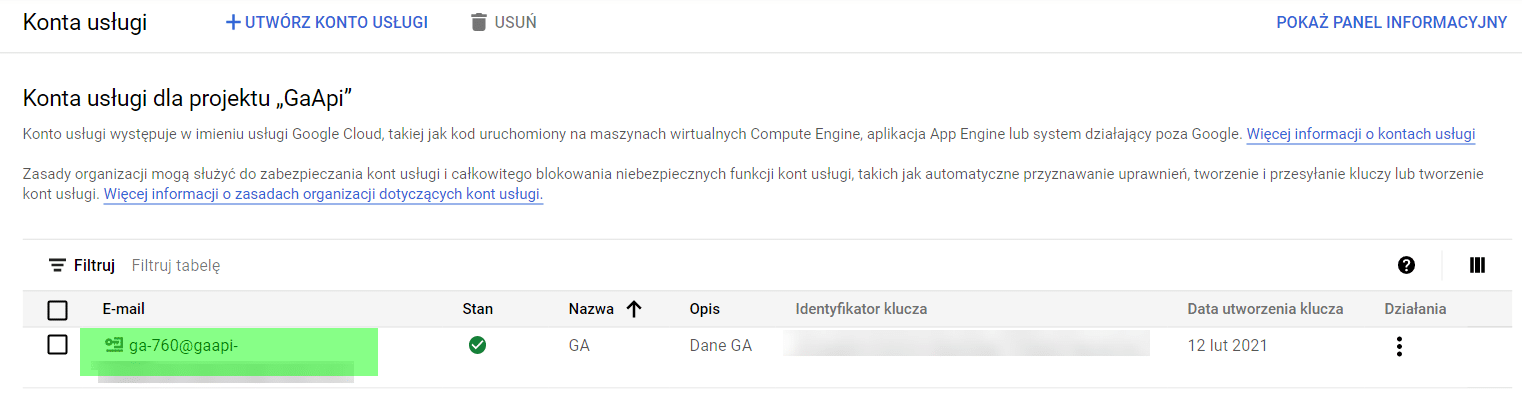
The next step is to create a service account. This will allow us to generate the address needed for verification in GA. We create this service account by selecting Administration > Service Accounts in the GCP menu (as below).
The last preparatory step is to add the GCP account user address (highlighted below) to the Google Analytics dashboard.
We will need the customer ID and customer key for authentication. We will save them as variables in R.
What are dimensions and data metrics
.
For those experienced in working with databases, the division between facts and dimensions will be familiar. Since one picture is worth more than a thousand words, I will try to discuss this pictorially.
Facts are events that are the basis for analysis (e.g., sales or service users).
Dimensions describe the facts. Facts can be broken down into dimensions (e.g., number of user sessions).
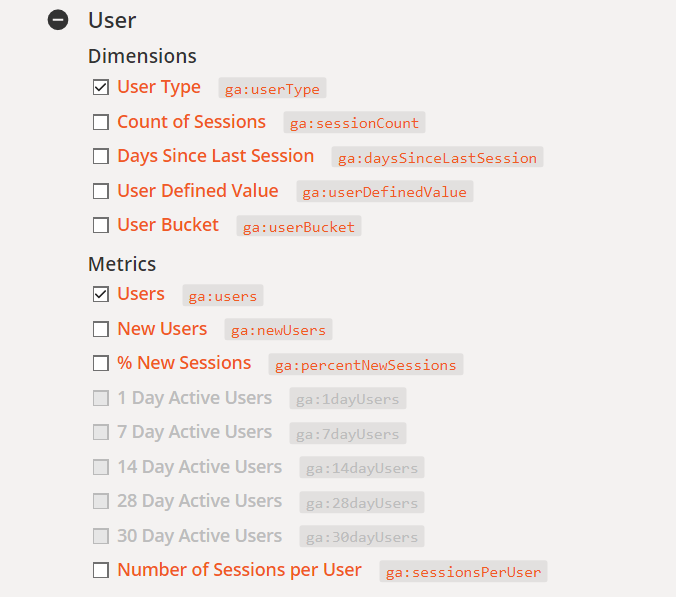
The following breakdown of data for GA (taken from this page) represents analysis where:
Fact - users of the site.
Dimension - type of user (here new or returning)
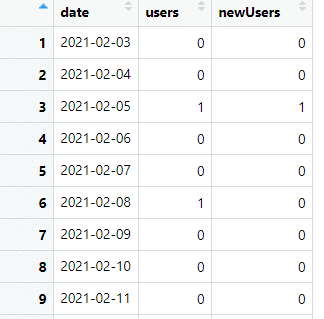
Metrics - number of users, date in format (YYYY-MM-DD i.e. 2021-02-15 for example).
This gives us data like the following:
And R code:
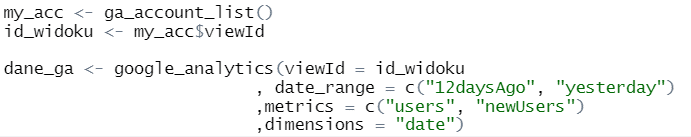
The entire code is available here.
Limits (sampling and amount of data) in Google Analytics reports vs. API
.
Google Analytics has limitations related to data sampling (more information about sampling here).
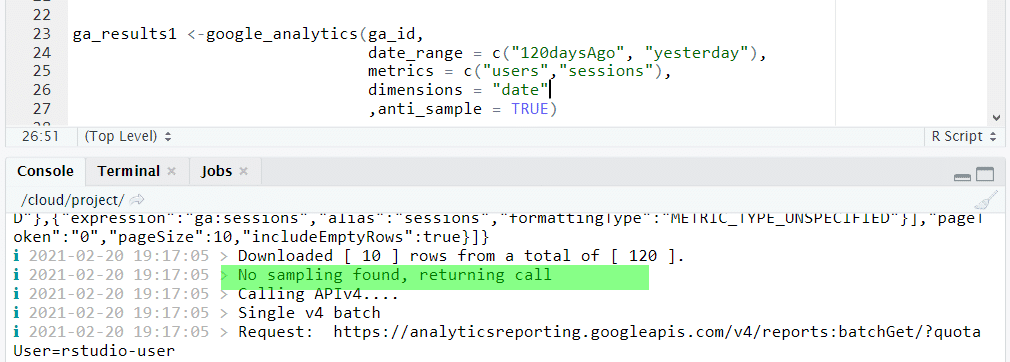
When downloading data, we can check it by using the anti_sample parameter. Its use causes the system to return unsampled data, if possible (that is, until we are within limits). The following example shows the feedback in the R Studio console, indicating that the report was taken without sampling the data.
Data download
.
Download a list of GA accounts we have access to
.
I always start my work with GA with this step. It allows me to verify that my script has obtained a connection to the API and that I have access to the accounts I am interested in. This is done by calling the ga_account_list() function.

Which gives us an object named my_acc containing information about the data views and GA accounts we have access to. This allows us to create an object (in this case a matrix named data_GA) containing all the IDs of the data views and account names we have access to.

This gives us the following object:

Number of results
.
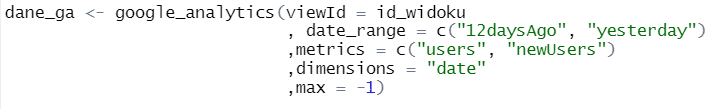
By default, the API returns only 100 results. The number of results can be set by using the limit parameter. To retrieve all results, give the limit parameter a value of -1.
Date ranges
.
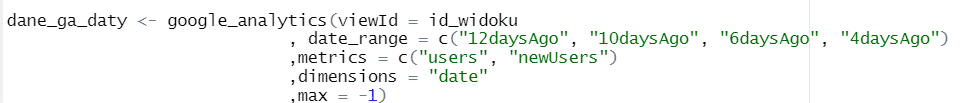
By default, the date range we retrieve is set via the date_range parameter. It is possible to select more than one date range.
What is very useful, instead of using specific dates (always in YYYY-MM-DD format), we can use universal parameters, such as yesterday or XXdaysAgo. It returns the date XX days before today (in place of XX we insert a specific number of days, so for example, 7daysAgo gives us the date 7 days ago).
Data filtering
.
Wanting to shorten the waiting time for data, it is worth using filtering. It allows you to retrieve only selected data. Filtering is possible on two levels: metrics and/or dimensions (the parameters met_filters - filtering by metrics and dim_filters - filtering by dimensions are used for this).
Met_filter() takes the following parameters:
- metric - the metric by which we filter (e.g. sessions) .- operator - takes one of the following values : .- “EQUAL” - equals .- “LESS_THAN” - less than .- “GREATER_THAN” - more than .- “IS_MISSING” - missing value .- comparisonValue - the value of the metric we want to filter or filter out .- not - if it takes a value of TRUE then we do not include data matching the filter in the results.
- Dim_filter() - we use this function with parameters: .- dimension - the dimension by which we filter (e.g. device type = Desktop or user country = Poland; .- Operator - works as with met_filter and can take one of the values: .- REGEXP - checks whether the field specified in expressions matches the specified regular expression .- BEGINS_WITH - starts with the specified filter .- ENDS_WITH - ends with the specified filter .- PARTIAL - includes the specified fragment .- EXACT - has a value exactly as given .- NUMERIC_EQUAL - is a number equal to the given .- NUMERIC_GREATER_THAN - is a number greater than the given .- NUMERIC_LESS_THAN - is a number less than the number given .- IN_LIST - is in the list of values we specify .- Expressions - an expression (the number or text we are looking for in the dimension name) .- Casesensitive - if it has a value of TRUE, it is case sensitive (upper/lower case) .- Not - works as with met_filter. .
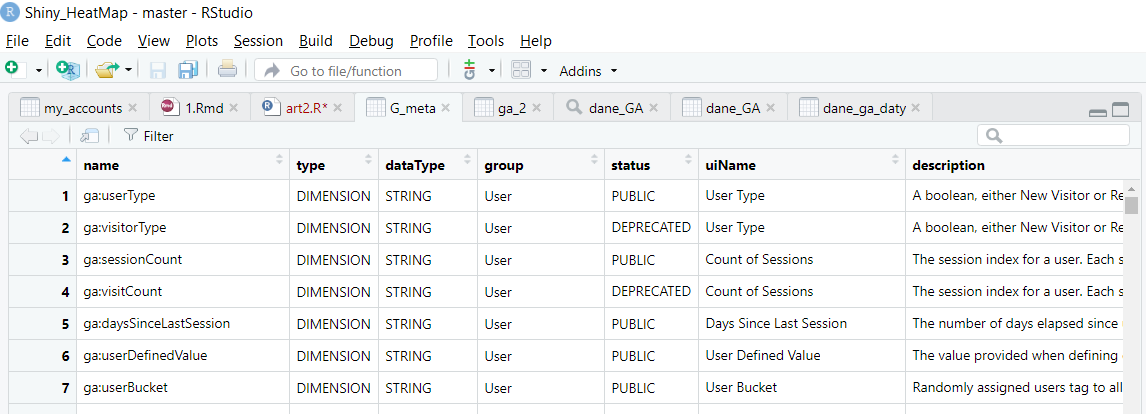
We can check the full list of filters and dimensions available in GA by using the ga_meta function.
Application example:
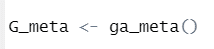
Gives us an object containing a detailed description of all (including those already withdrawn - marked as DEPRECATED in the status field) dimensions and metrics.
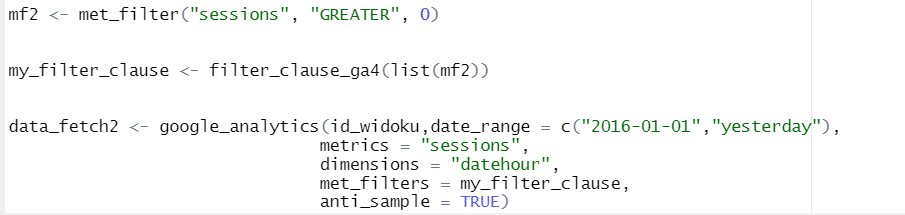
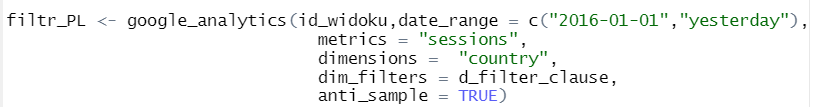
After creating the metrics and/or dimensions filter object, you need to create a filter object by using the filter_clause_ga4 function. This is the object we use in the google_analytics function. This allows us to build advanced filters for combinations of more than one metric and/or dimension.
Below we filter the data to include only visits (metric) from the country Poland (the dimension named contry takes the value Poland).
We create a filter for data where the country dimension contains exactly the string Poland - that is, we reject all visits from countries other than Poland.

We create a filter object based on this filter:

We use a filter object in the function that retrieves the data:
The code used in this section is available here.
Summary
.
Many of us SEOs focus on the Google search engine. Of course, tools like Direct Answer give a lot of insight into what’s going on in the search engine. Even so, the basis of any analysis should be data from Google itself. I started my adventure in applying programming to SEO precisely by downloading data from the tool described here. For me, this translated into a better understanding of what is happening in the search engine and, in the end, higher positions. Like all tools, those from Google require an understanding of the capabilities and limitations in order to be used well.
The most important things you need to keep in mind:.
- Google analytics data is not 100% aligned with Google Search Console data .- Google data does not share information about competitors .- Google analytics data is collected “on your side”. - so you can upload a lot of additional information (e.g., for blog posts the name of the author or the name of the manufacturer in the store) .- Google Search Console data is collected on Google’s side - therefore, you only need to create an account to collect data.
With the R language you are able to:.
- collect large amounts of data (much more than you can fit in excel - a little over a million rows) .- export the resulting data (e.g. to excel) .- combine data from multiple sources .- bypass the limitations of Google’s free tools if possible .
I encourage you to test, comment and implement the solutions I’ve described here, or your own ideas.
See you in the SERPs!
Thanks for reading!
Sign up for free and join over 14,000 Senuto users ????

Sebastian Mioduszewski
Z branżą SEM/SEO związany od 2007 roku. Od 2012 odpowiedzialny za budowę i realizację strategii SEO dla serwisu Pracuj.pl. Jego doświadczenie jest nakierowane na działania SEO stanowiące odpowiedź na potrzeby użytkowników. Jego mottem są słowa Izaaka Newtona: „Standing on the shoulders of giants”, które rozumie jako codzienne angażowanie do swoich działań nowoczesnych technologii i bazowanie na wiedzy i doświadczeniu wielu współpracowników. Na co dzień współpracując z zespołem Product Development liczącym ponad 100 osób nauczył się rozumieć potrzeby użytkowników i punkt widzenia specjalistów.
All articles →