How to use Google Trends and other tools to find trends on the Internet?
Google Trends is a free, inconspicuous tool that, as the name suggests, is used to analyze prevailing trends. Google provides us with its data on search terms typed into the search engine, so we can see what phrases are gaining in popularity, what information Internet users are looking for, as well as the popularity of a particular search term in particular regions. What will this information be useful for? By interpreting them properly, we can make marketing and business decisions based on verified and reliable data. And only such actions can help achieve success.
What is Google Trends and how does it work?
.
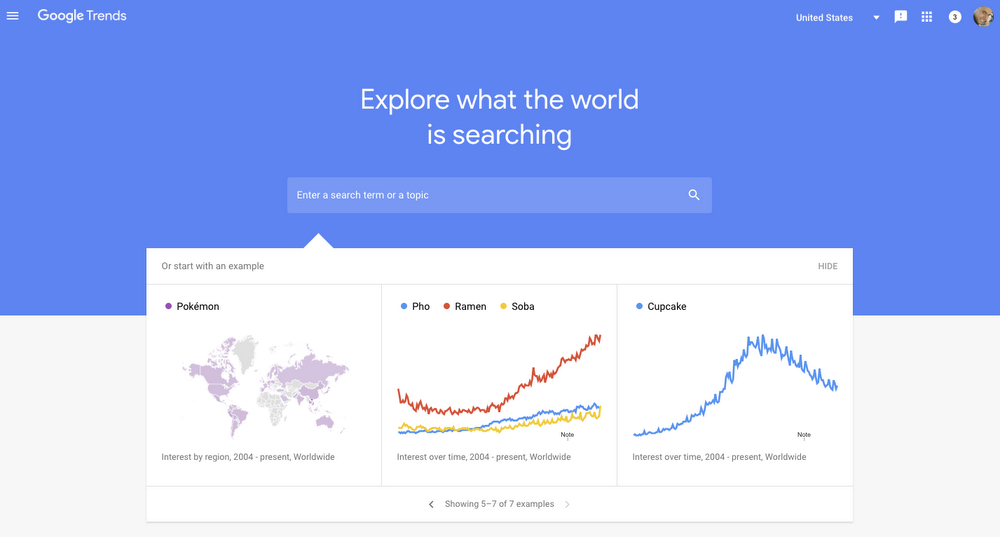
Google Trends can help when developing an effective marketing strategy. How to use its potential? A simple and intuitive interface will guide us through the sections on trend analysis. On the main page of the tool, we can see what topics are gaining popularity and what search terms were popular in the search engine in previous years.
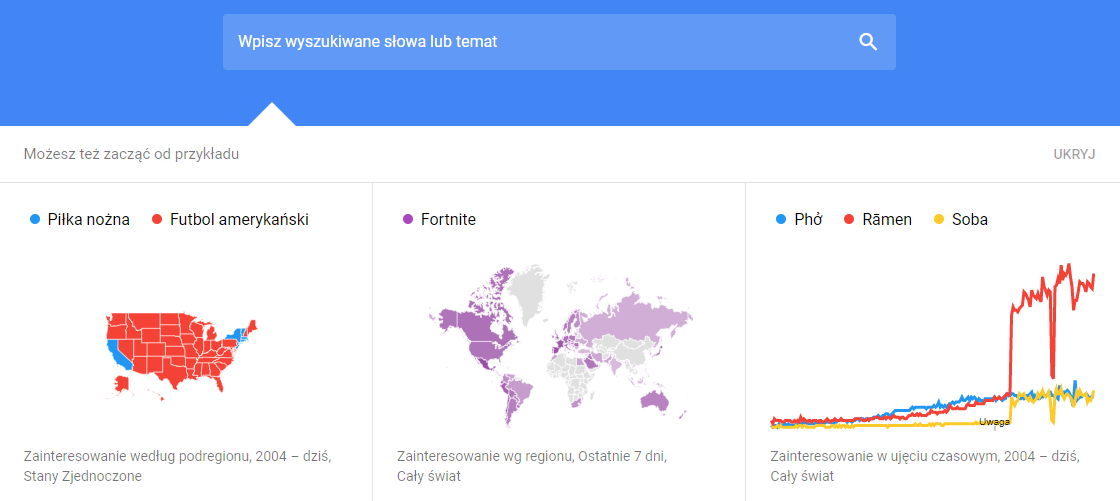
Sample analyses will help us get an idea of the capabilities of the Google Trends tool. Various maps and charts show how to visualize our data and how to compare results with each other. In the rest of the article, we will suggest how to use Google Trends and how to exploit its potential in an SEO campaign.
How to use Google Trends?
.
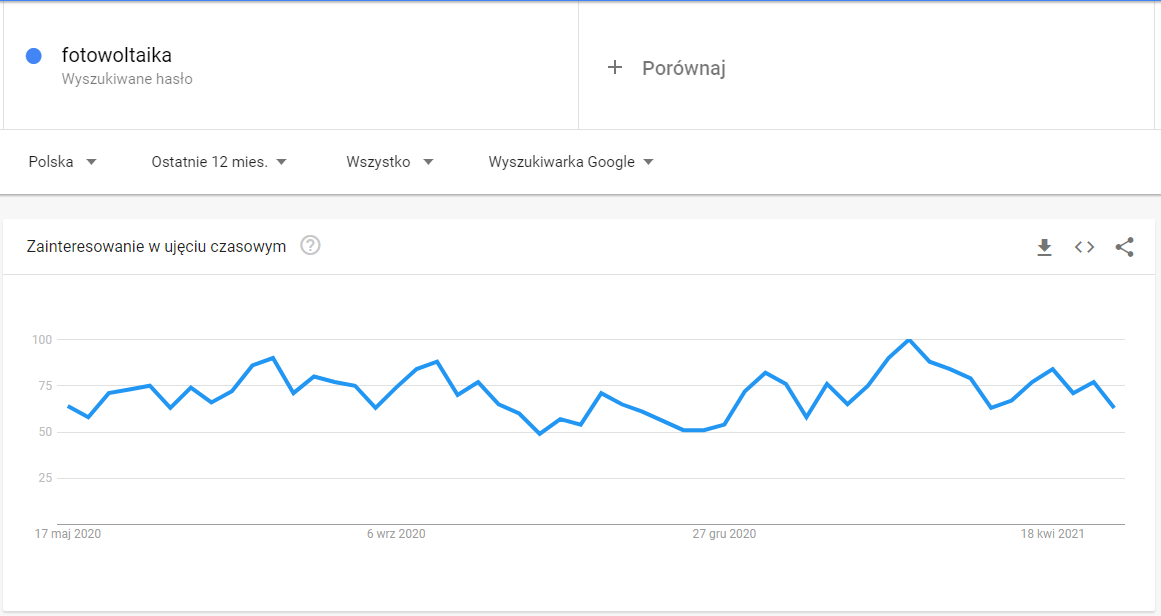
After typing in a keyword of interest, we will get results on its popularity. The standard settings are searches in Poland, in the last 12 months and from all categories.
 Google Trends - interest by time.
However, each of these filters can be changed, and so:
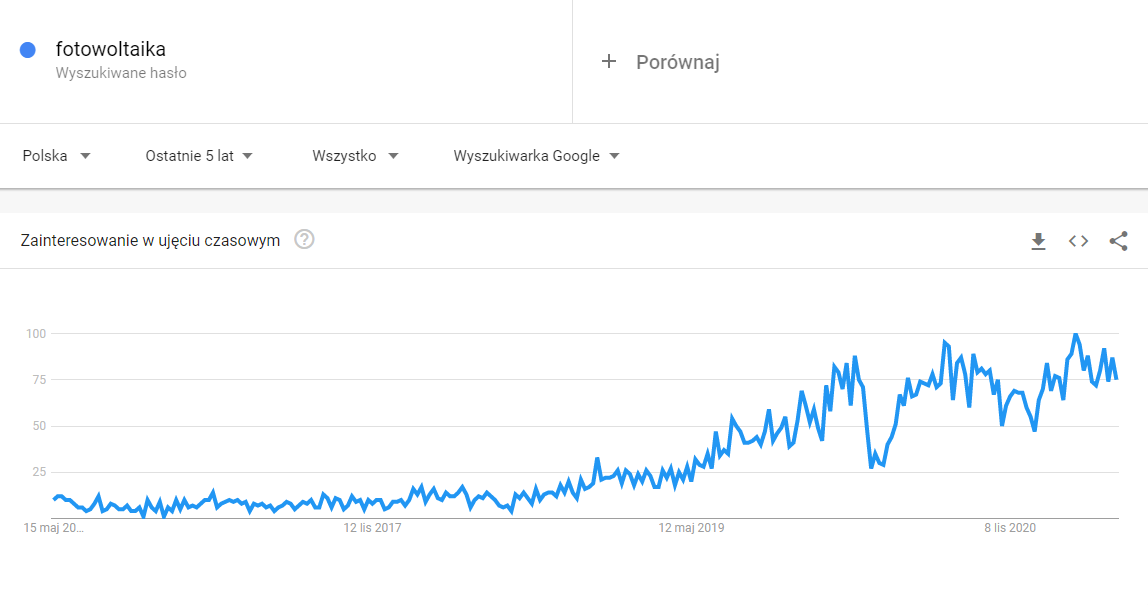
We can select a different country or even the whole world. This will work especially well if you are searching for phrases in another language or want to compare the frequency of a phrase by world region. Changing the time snapshot will give you a broader view of the changing popularity of a phrase - so you can see if a keyword has been searched for by Internet users, and for how long. You can easily get information about keywords that have long ceased to be popular, as well as check the seasonality of certain products and services.
 Google Trends - interest by time.
When we change the time filter to the last 5 years, we can see that the keyword photovoltaic is steadily gaining in popularity.
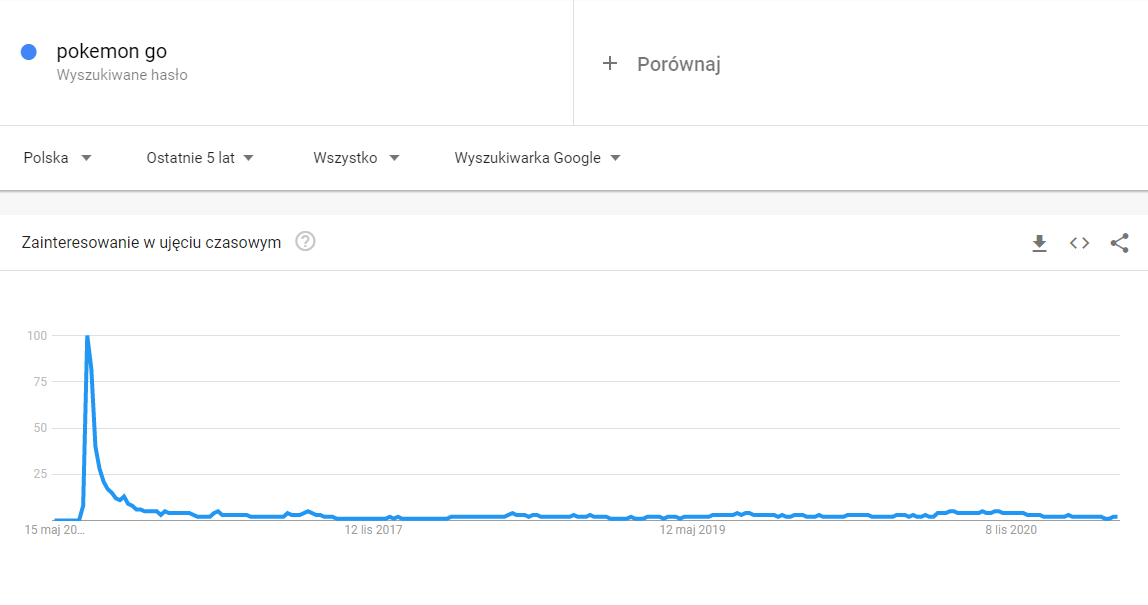 Does anyone still remember the popular mobile game Pokemon Go? Yes! But it’s certainly far fewer people than in June 2016, when the game reached its peak of popularity. Thanks to such information, we know whether it is worth continuing to invest in the promotion of a product, or whether its five minutes are long behind it.
 Google Trends - interest by time.
Google Trends - interest by time period
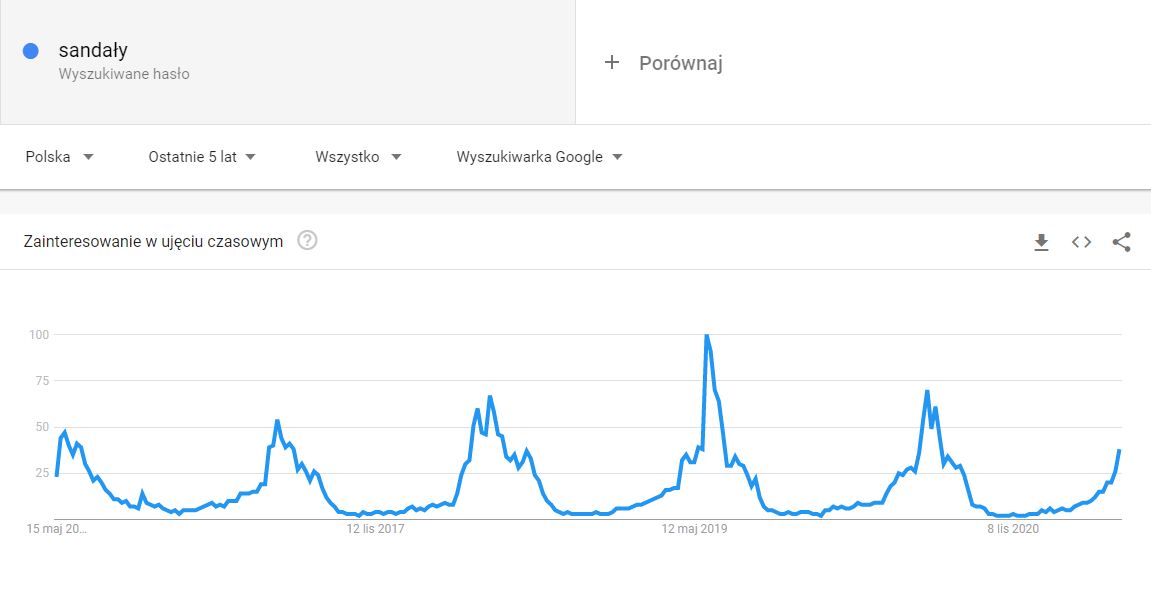
By entering the names of your products, especially seasonal ones, into Google Trends, you can see when users start searching for information about them and adjust your ad schedule according to this data. The surge in searches for the keyword “sandals” occurs annually in late April and early May, to reach its peak in early June. With such information, we can be one step ahead of the competition and start promoting the summer collection as early as the end of spring.
It’s also a good idea to compare the results of our query for all categories and choose the one most similar to our keyword. Why might the results be different? It happens that the phrase we are looking for has a different meaning depending on the context.
The popularity of the word “bathrooms” in the context of a room in the house, in the Home and Garden category, and differently as a destination for travel and walking in Warsaw.
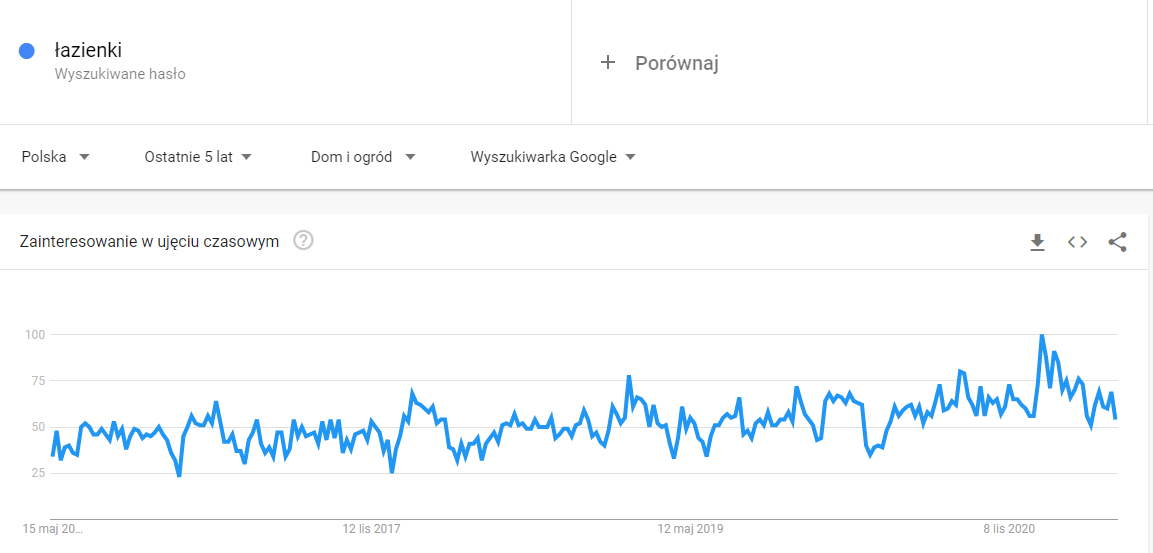 Google Trends - Bathrooms - Home and Garden category.
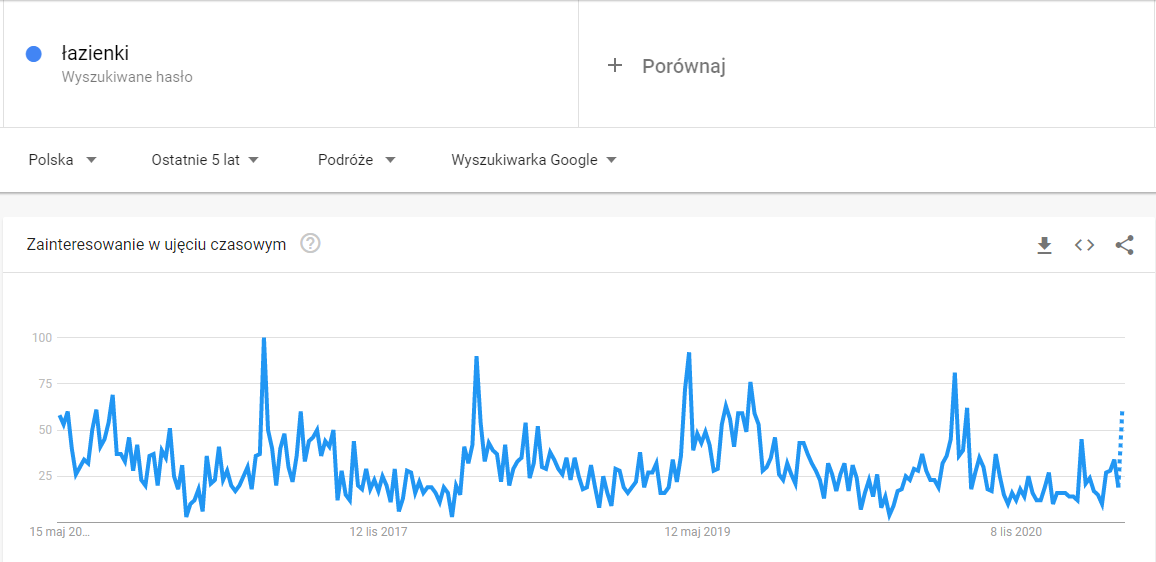 Google Trends - Bathrooms - Travel category.
If the name of the product or service can have different meanings depending on the category and topic - it is worth using this filter.
Interest by sub-region
.
Another section in Google Trends is results by region. On the map of Poland, 16 provinces are marked, and the intensity of the colors indicates where the phrase is most popular. If you select another country or the whole world, a map of the region in question appears analogously. What will the data on the popularity of a phrase in each region be useful for? Let’s think about all the regionalisms and how one thing is referred to in different ways. An example would be Malopolska’s “flizy,” which is a regional term for tiles.
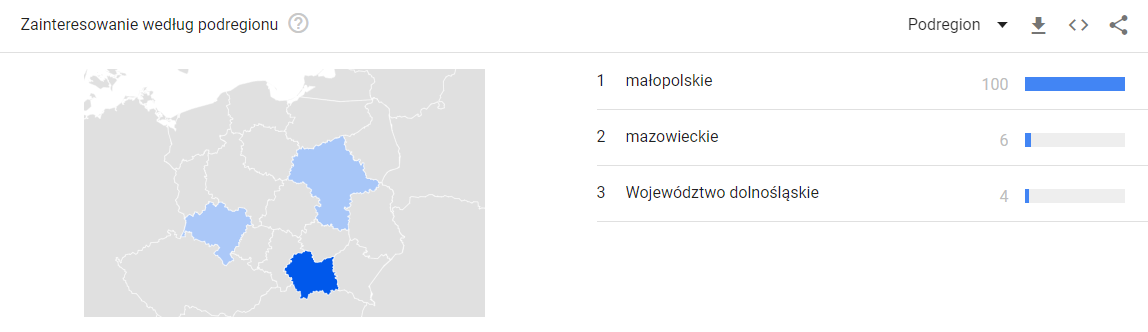 Google Trends - interest by sub-region.
However, when you want to reach customers from all over the country, too much regionalization will not serve expansion. There are many similar examples in English, where there is a slightly different vocabulary depending on whether you use the British or American version. It is worth verifying this before using the word “underground” to describe the subway in an article published in the New York Times. ????
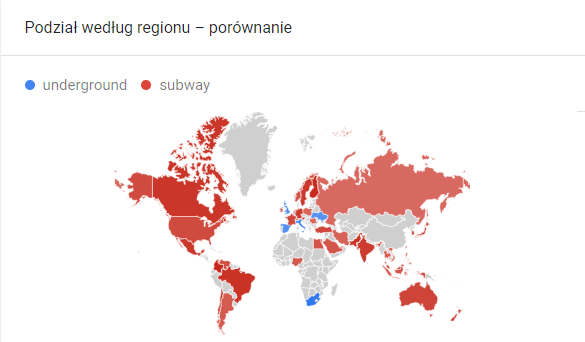 Google Trends - breakdown by region - comparison.
Results comparison
.
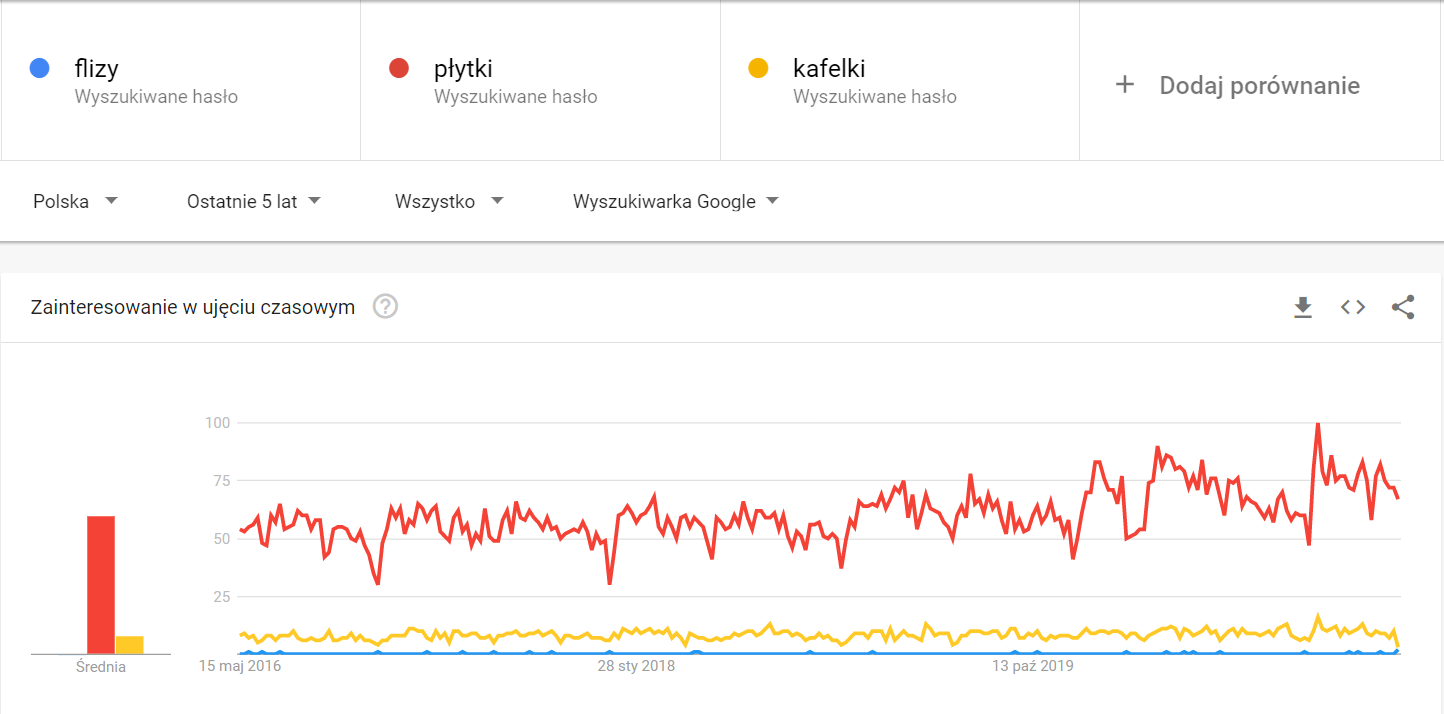
Users searching for products and services on a search engine type key phrases in different ways. Which ones are typed into the search bar more often? Google Trends allows you to compare several phrases with each other, so you can find out which one is the most popular and worth investing in its promotion.
 Google Trends - comparison of results.
Google Trends does not show the exact number of searches, but in the graph it is clearly visible that the phrase “tiles” is much more frequently searched for than “flize” and “tile.” Examples can be multiplied, and the most important thing we can draw from this data is to know what phrases to use in our website content. If we compare the different products available in our assortment with each other, this will also help us decide which products to promote first.
Similar topics and similar queries
.
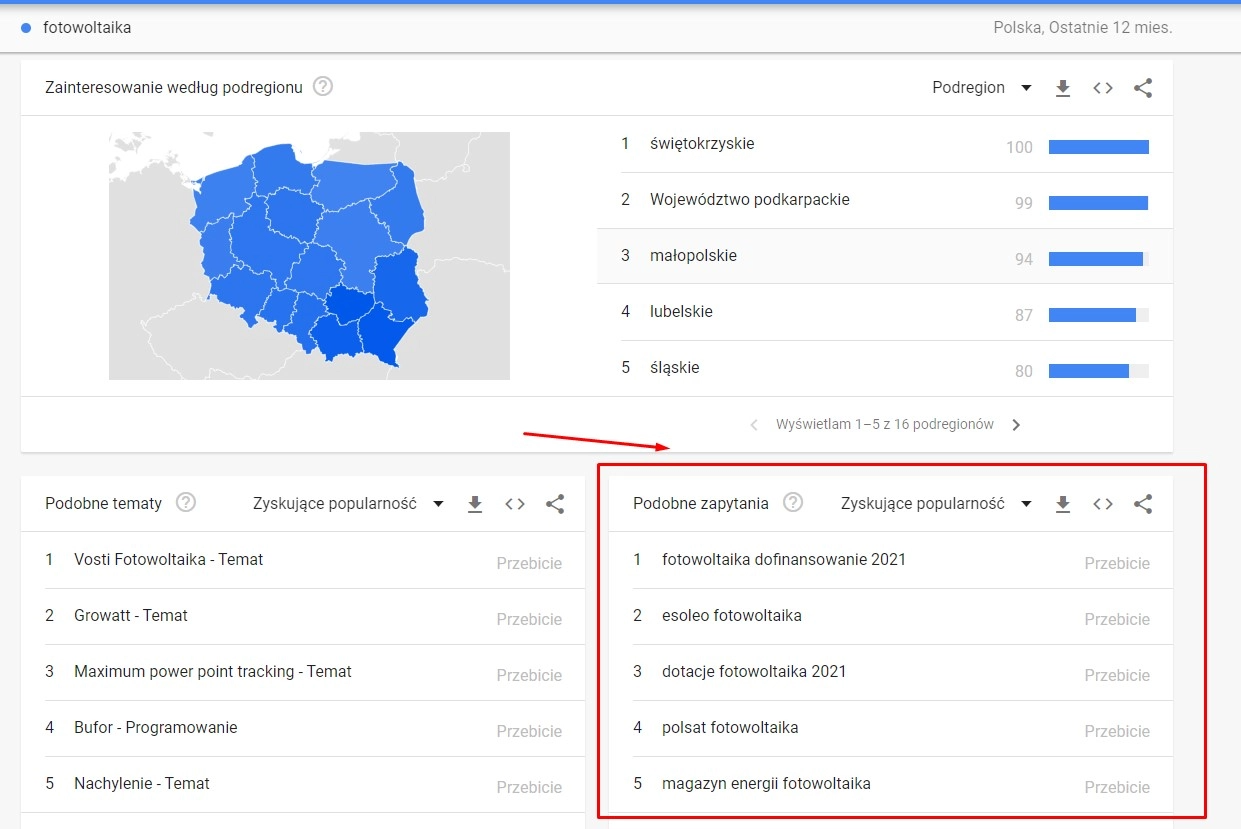
Below the results for each region are two sections - similar topics and similar queries. These are topics and phrases that interested users searching for our keyword. What is the difference between topics and keywords? Similar keywords for “tiles” are other phrases containing them, such as: “tile linear drain” or “bathroom tile stickers”. Users typing “tiles” also searched for topics such as BOMAR, Architectural Concrete and Terracotta.
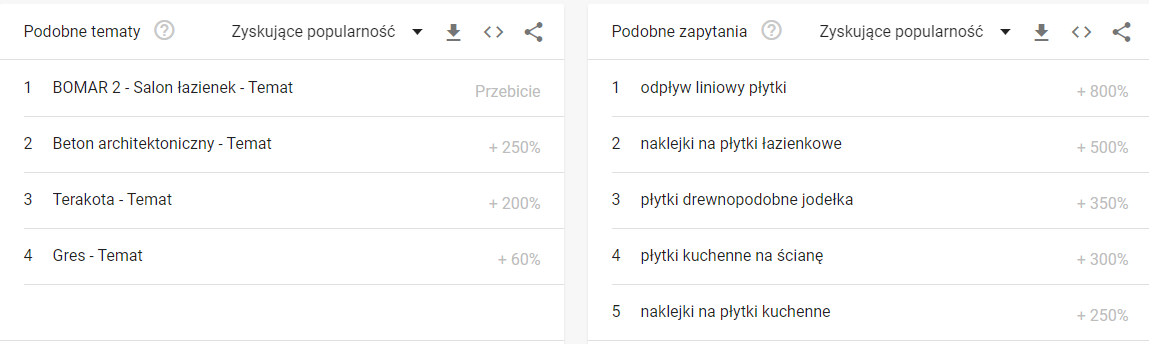 Google Trends - similar topics and similar queries.
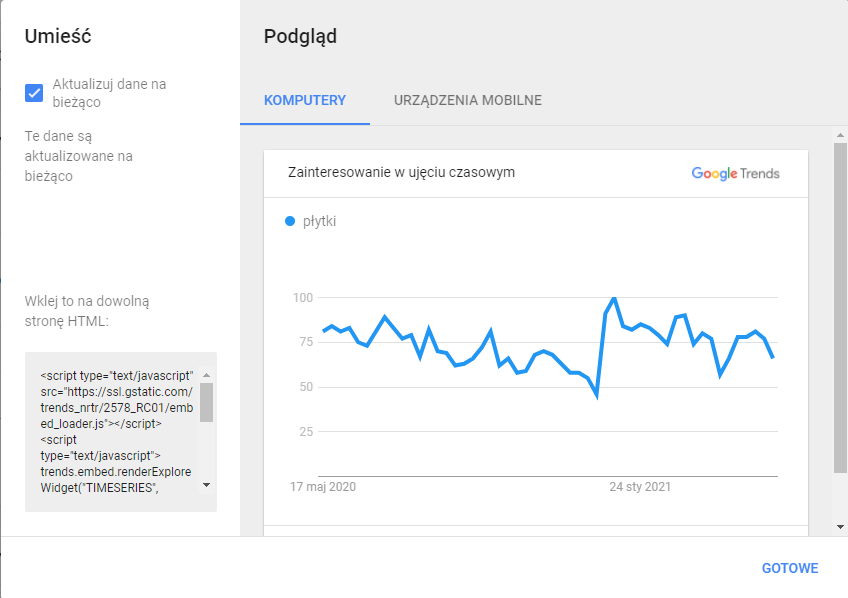
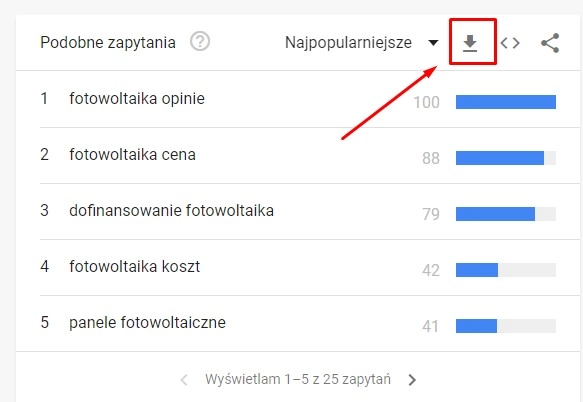
Both search terms and topics can be sorted by most popular or gaining popularity. Each of the results: Interest by Time, Interest by Sub-Region, as well as Topics and Queries can be downloaded either as a CSV file, shared on social media, or placed on your site with a snippet of HTML code.
 Google Trends - Data Download.
Google Trends and SEO
.
Google Trends is a great tool for real time marketing and social media management. It allows you to keep track of trends and create creatives in response to the growing popularity of a topic. But how do you use this tool in your SEO strategy? It can be used for simplified keyword analysis - thanks to it, we can not only compare individual phrases with each other, but also gain access to keywords that users were also interested in. One of the biggest advantages of this tool is information on seasonality. When running an online store or offering seasonal services, such as Christmas tree sales or tire replacements, it’s worth checking how early users start to be interested in a particular topic. However, SEO activities always need to be planned in advance so that the optimization is noticed by the search engine algorithm.
Search volume vs. popularity - how to interpret the data?
.
It is also worth noting that Google Trends does not show the number of searches for a given keyword, only its popularity. The average monthly number of searches for the phrase “photovoltaic” according to Senuto is 135,000.
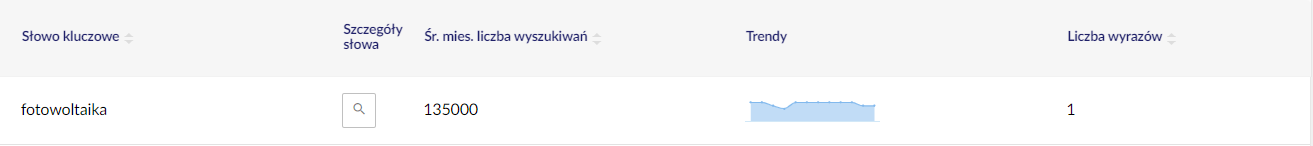 Senuto - Keyword Analysis.
Google Trends shows the popularity of a phrase on a 100-point scale, where 100 indicates the moment of greatest popularity in a given time frame. Over the past five years, the popularity of the phrase “photovoltaic” has been rising to reach its peak popularity in February 2021.
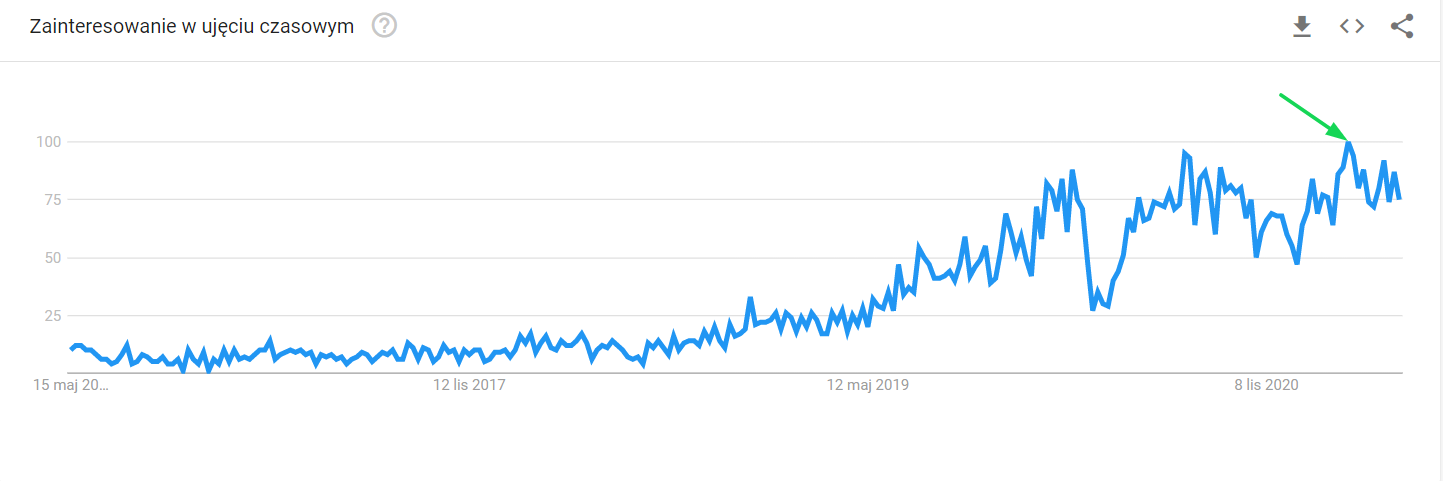 Google Trends - keyword popularity.
For seasonal phrases, such as “Christmas tree,” you can see an increase in the trend during the peak period of popularity of a given keyword.
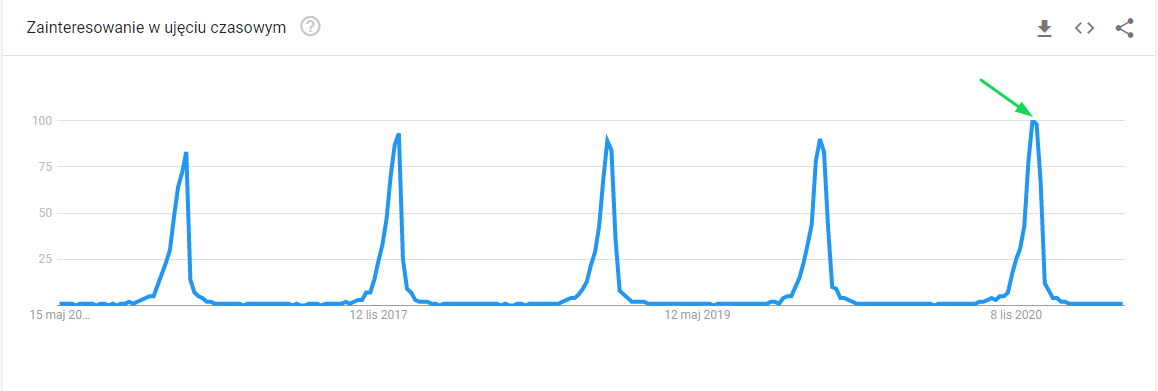 Google Trends - keyword popularity.
How to search for words with Google Trends
.
By using Google Trends data, we can perform keyword analysis. However, it is worth remembering here that this works well as a supplement to standard SEO campaign building - using Senuto’s keyword database for this. By analyzing the word “photovoltaics” in Google Trends, we can see which words are gaining popularity:
 .
.
We also have the ability to select the most popular queries and generate a report from them:
We then have a sheet of keyword ideas:
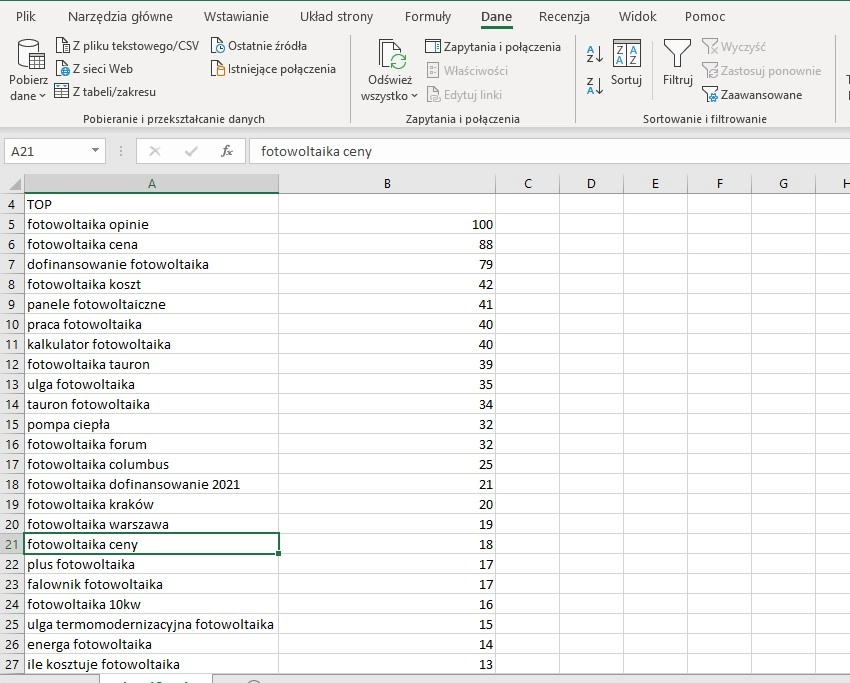
The data obtained in this way, it is worth comparing with the keywords selected so far.
Seasonality of keywords
.
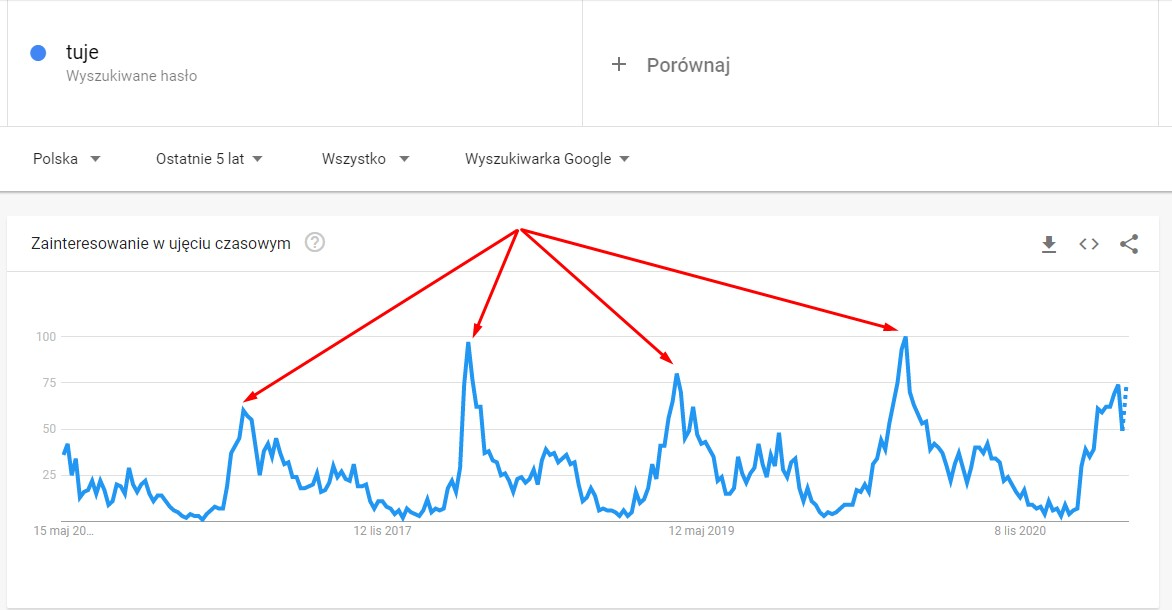
The main advantage of the Google Trends tool is that it shows seasonality - not only of the keyword itself, but also of the given topic. Before planning marketing activities, we can check whether a particular product is popular only at a particular time of the year. An example of such seasonality could be the word “thuyas,” the ever-growing trend of fencing off neighbors ????
 Seasonality of keywords.
This is probably due to the period when you can start planting them - the period of popularity coincides with the information below:
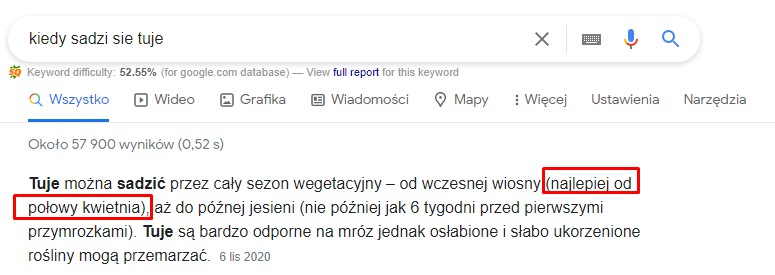
Another example of a seasonal keyword that shows periods of shopping popularity is the word “rollerblades.”
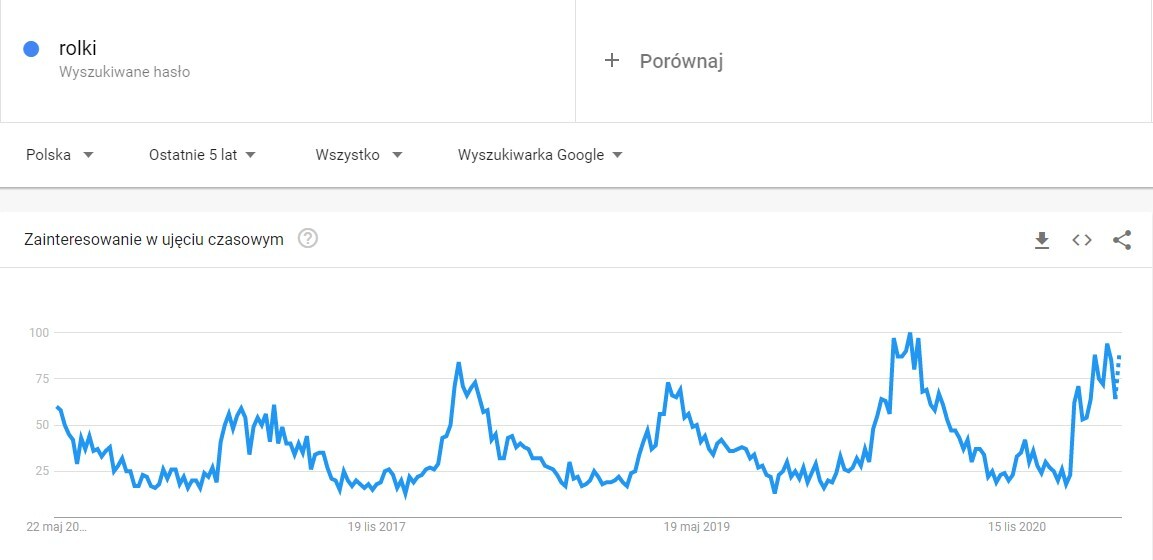
Due to the possibility of driving in spring, summer and autumn - the phrase is most popular mainly at the beginning of the season, i.e. in April and May.
Popularity in locations
.
When planning marketing activities, it is worth noting the differences in popularity of services and products between different regions. With Google Trends, you can verify in which locations you can run Google Ads campaigns, for example, and count on traffic and potential sales. To show the performance and reliability of the data, you can compare keywords popular in one region, such as the Lodz region:
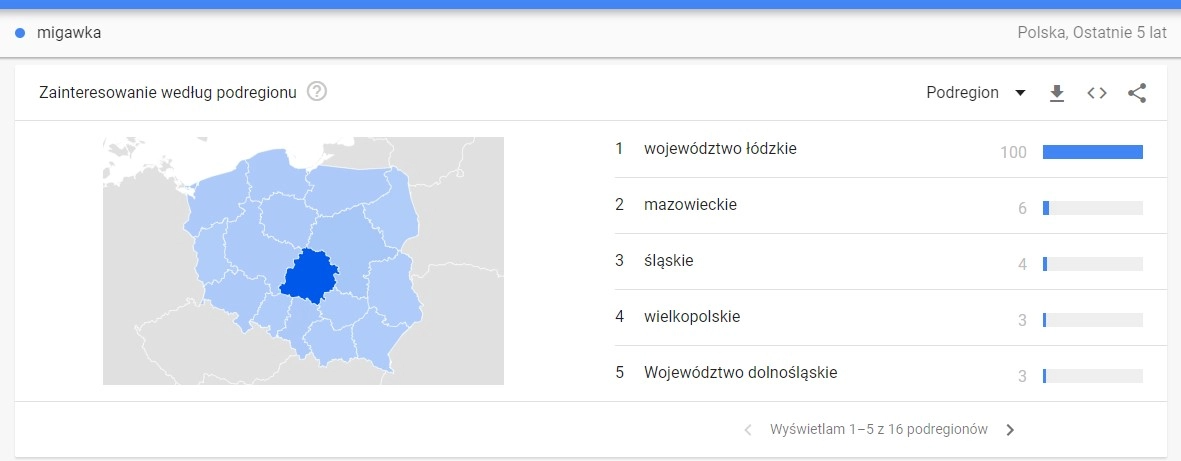 .
.
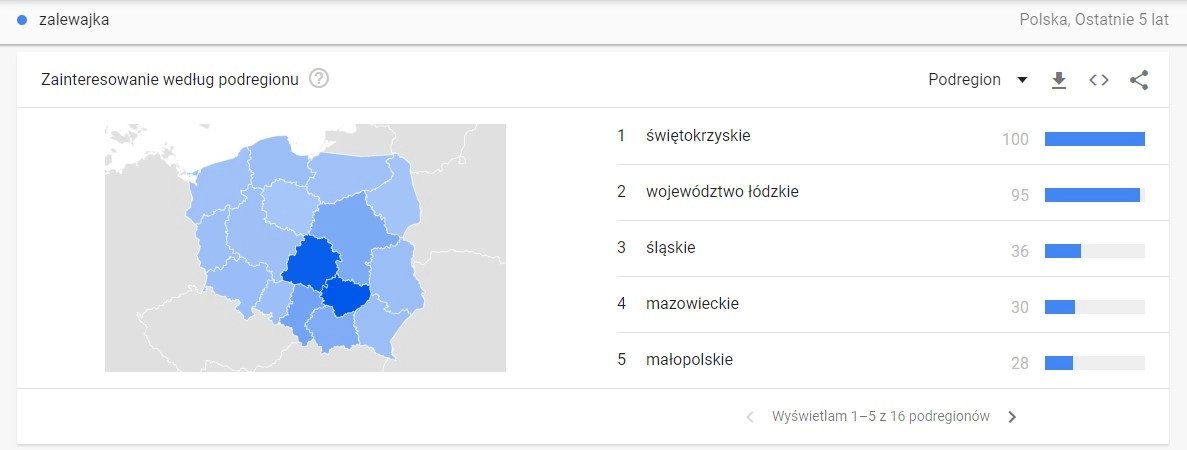
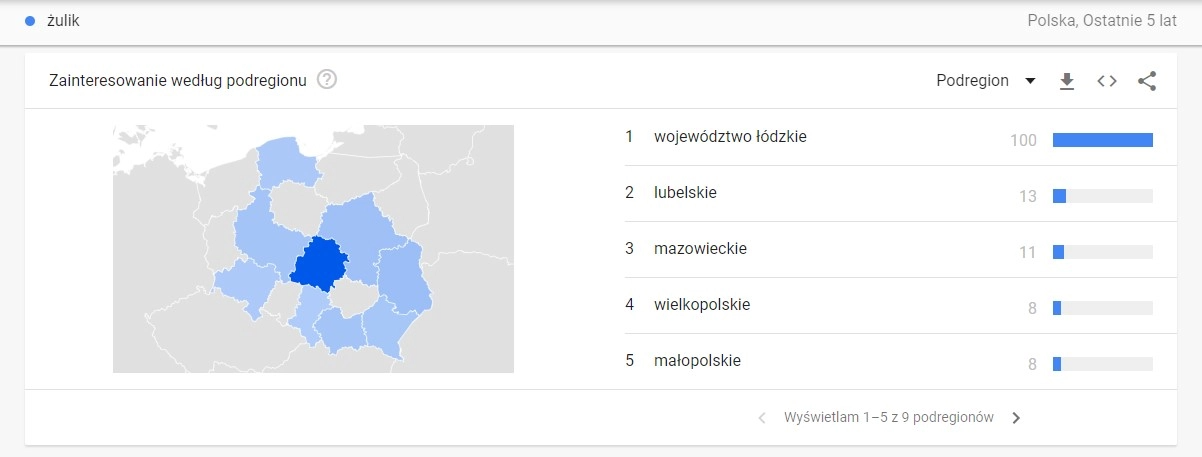
We can see from the screens above that there is a group of keywords that are regionalisms - they are used in one or two regions. Before planning a marketing campaign and recalculating the number of potential hits based on the average search level, it is worth checking whether it is better to focus only on specific regions.
Compare keyword popularity
.
Another interesting feature of Google Trends is the ability to compare multiple keywords and topics. In this way we can verify, not only whether a particular term is becoming more frequently searched, but also the correlation with popularity of other keywords.
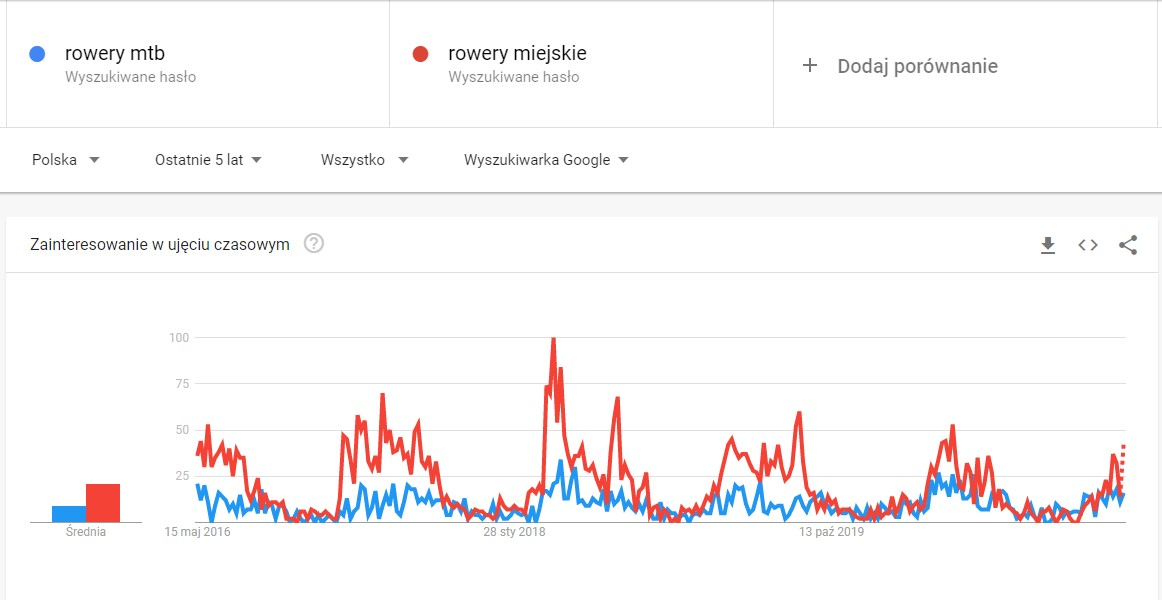
Let’s start by comparing two different types of products - differences in popularity and trend analysis:
 .
.
We can see from the above graphic that city bikes are becoming more popular. In addition, this is compounded by the presence of “urban bicycle” programs for rent, present in many large cities. In 2020, the popularity of urban bicycles declined quite a bit, which may be influenced by the epidemiological situation in the country. More and more people are working remotely, giving up their office jobs. If you don’t commute, you don’t need a bicycle like before.
We can also compare keywords, which in our opinion are terms for the same service or product. Such a comparison will give us an opportunity:
- determine which term is more popular .- verify whether any term is no longer in use .- determine in which regions the phrases we recognize as synonyms are popular .
We will make such an analysis based on the terms “mountain bike” and “MTB bike”, which are used by many people interchangeably. Google treats this similarly, as evidenced by an analysis of related words in the Senuto keyword database.
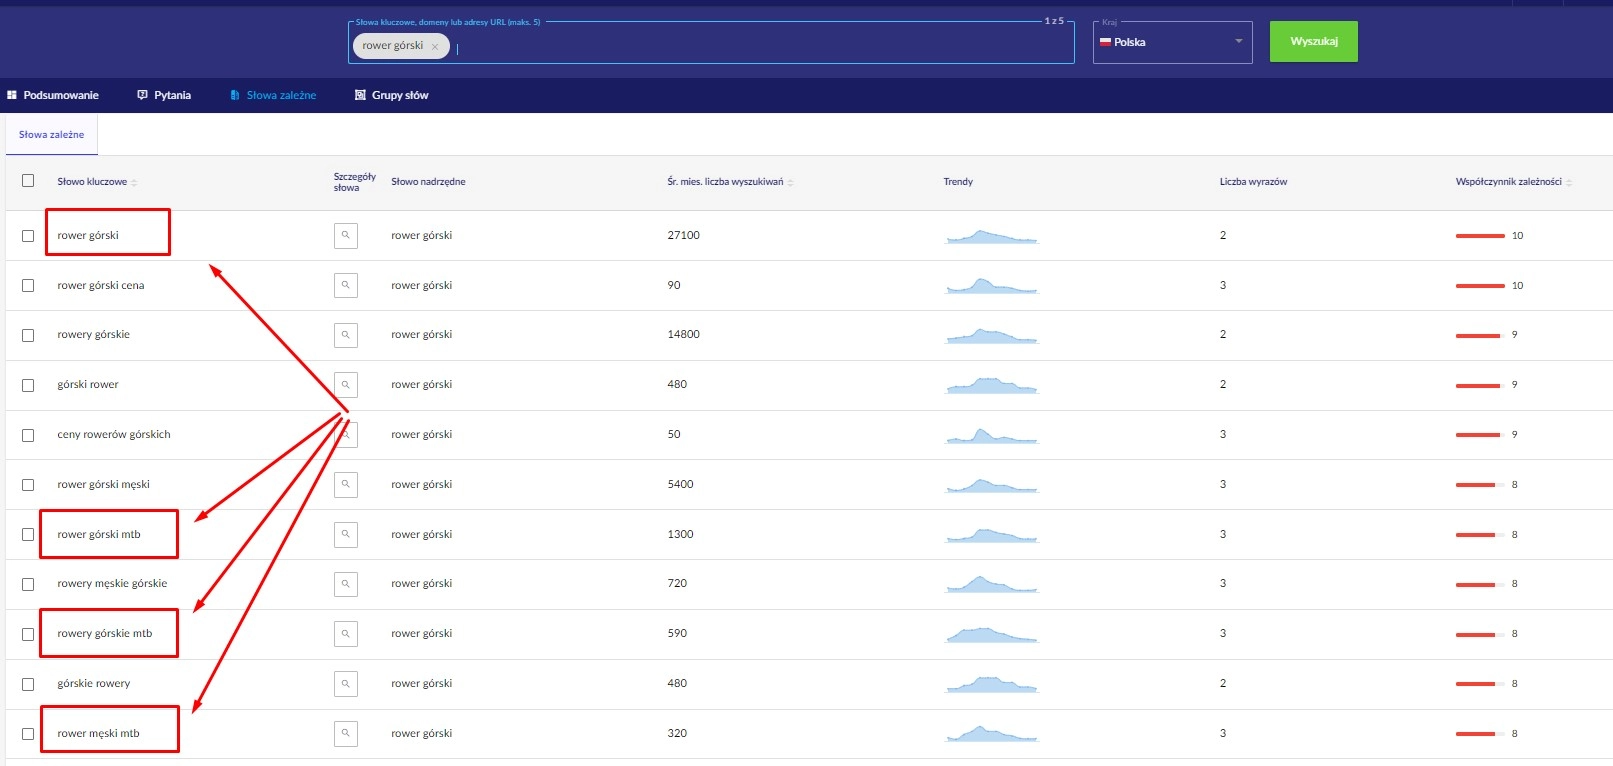
We see above that Internet users even type these terms together. So let’s go back to the comparison:
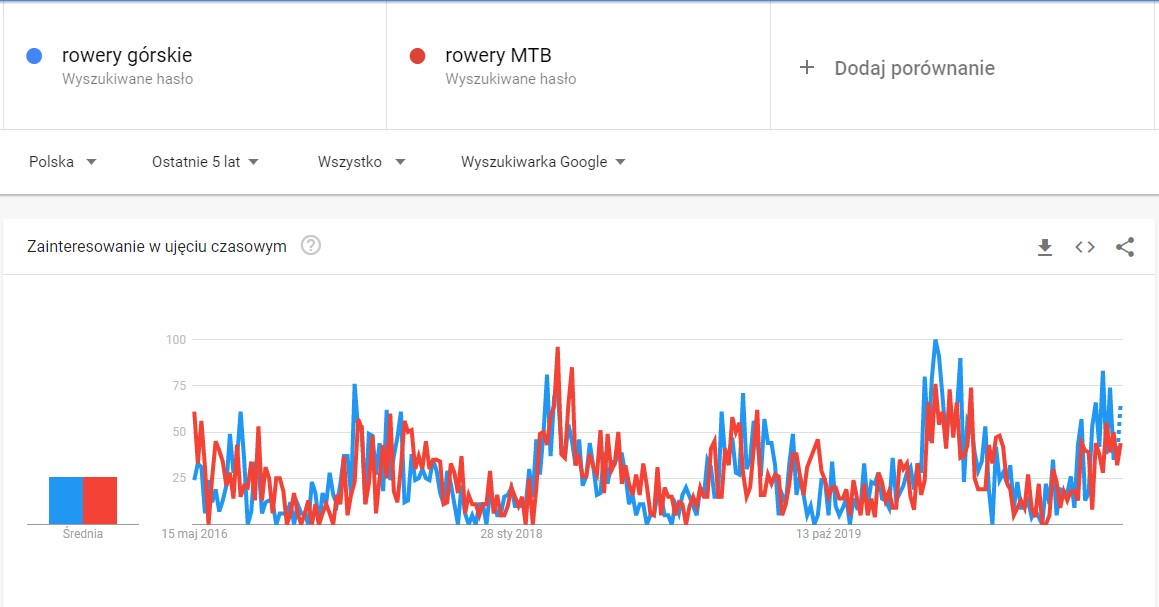
We see similar popularity here, but what else can be seen in Google Trends is a breakdown by region.
This data can be useful when choosing the right words for marketing campaigns in a given region.
Evergreen content
.
Anyone with even a passing interest in SEO and content marketing has come across the term “evergreen content” - content that is not prone to seasonality and its popularity is constant. This type of content is very often chosen when we make an editorial plan and are concerned about generating constant traffic. To this group of content we can include, for example, glossaries/encyclopedic dictionaries, or product rankings. While in the former case we can create content once and enjoy the traffic, in the case of rankings - we need to update this content.
Below is an example of encyclopedic content:
 .
.
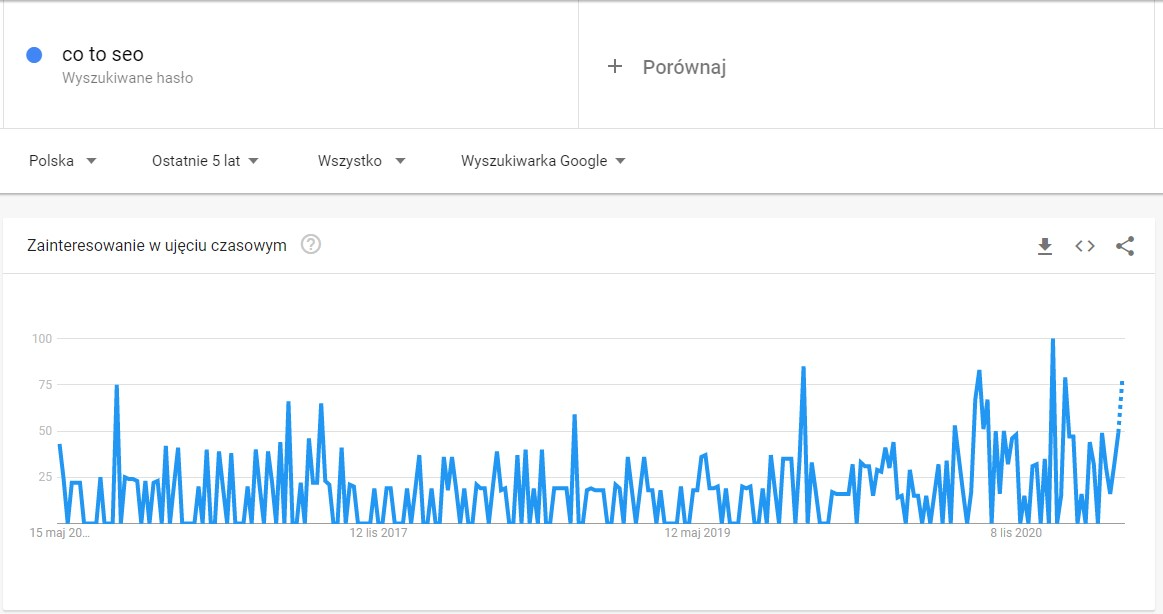
This query is not about any event, season, and as we can see in the chart above, it is not seasonal. We will now move on to another type of query:
 Google Ads - Keyword Planner.
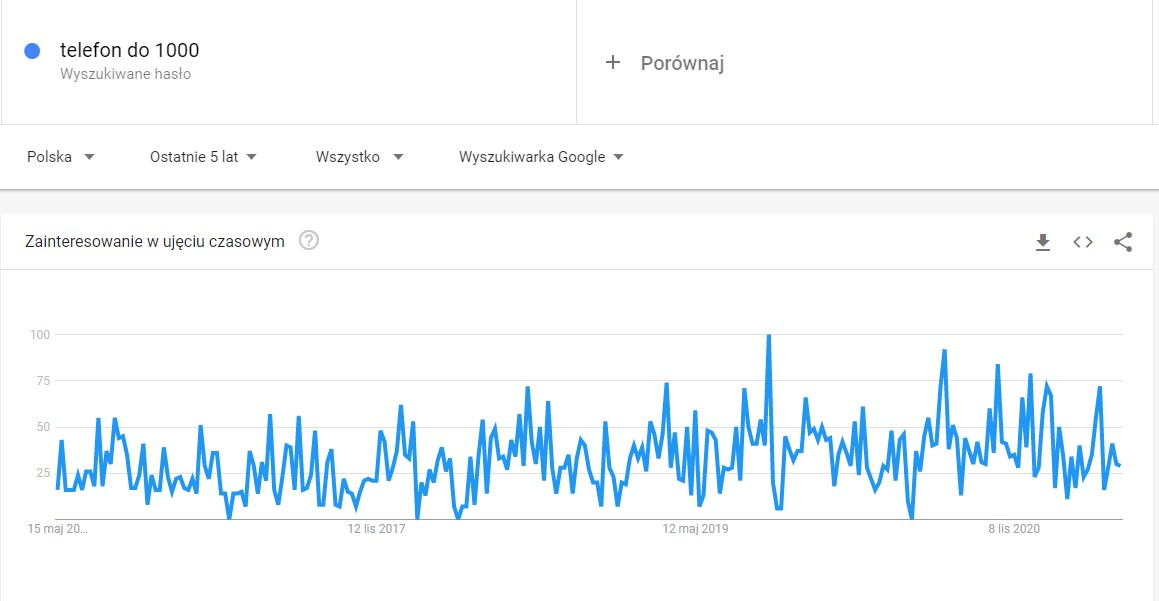
This is a topic-related query that is not characterized by seasonality. Here we see a relatively even level of popularity throughout the year. However, it is worth remembering that the phone industry itself is changing dynamically and it is necessary to constantly update this type of sub-query.
Determine the cause of traffic decline
.
During our daily work on SEO campaigns, we often notice changes in traffic due to seasonality of keywords. That’s why, in case of traffic drops from free search results, it’s worth starting with analyzing whether it’s due to position drops or seasonality of phrases. For such analysis, Google Trends works very well.
Read also: SEO in the seasonal industry - how to keep your website traffic year-round?.
We can see in the graphic below what seasonality looks like in a christening-related industry - for example, a christening clothes store. Until February 2020, the seasonality and behavior of Internet users was constant. Between October and February, traffic was much lower.
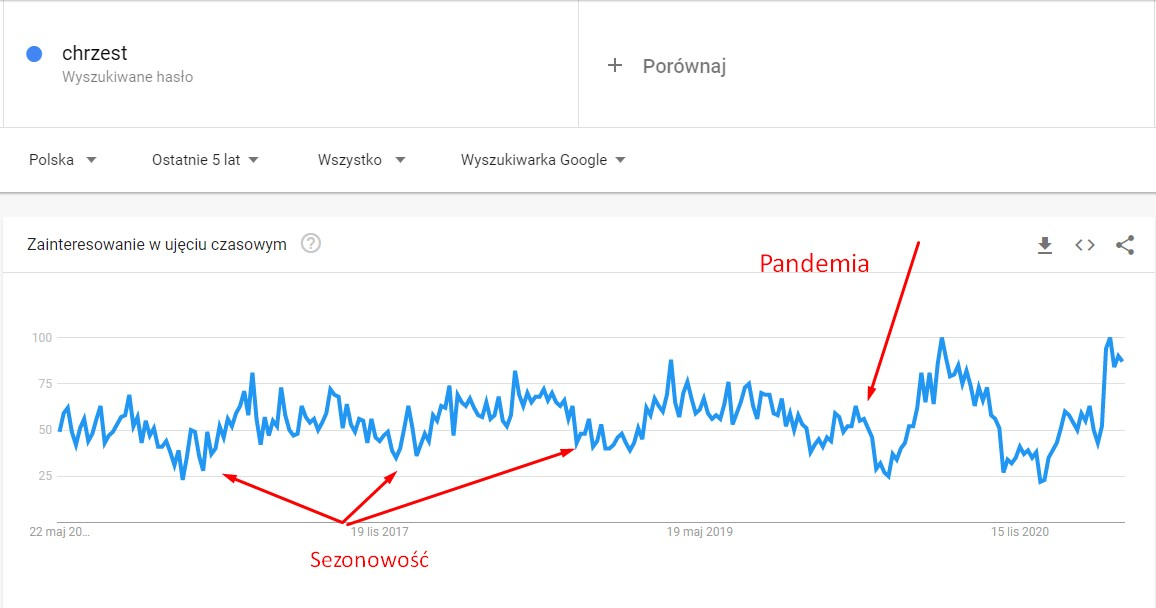
As of February 2020, things have changed sharply. First, we see a huge drop in interest, as everyone was looking for information about coronavirus. In addition, we were confined to homes, which ruled out family events. During the holiday season, the restrictions were lifted and we can see interest in the topic of baptism again.
Google Trends versus Google Ads
.
You always have to wait for the results of SEO efforts - increases in positions and visibility are usually the result of long-term strategies. Google Trends and other trend-tracking tools will assist your SEO campaign during keyword analysis, helpplan content creation on your site, and decide which topics, due to their popularity, are worth our attention first.
The case is different with SEM campaigns, or paid search results. In the case of Google Ads, their effect is visible almost immediately after the campaign is paid for and set up. By analyzing the results from Google Trends, just like in SEO, we can plan a campaign calendar based on the seasonality of keywords. It’s a good idea to check when interest in our products increases and prepare to launch a campaign then.
Using Google Trends, it is possible to discover topics and keywords that are gaining in popularity. We never know when any of the products in our offer will suddenly become popular. The reach of influencer and viral campaigns sometimes surpasses our wildest expectations.It is worth taking advantage of the prevailing trend and increasing the campaign effort for a particular product. While this may be a one-time surge in demand, it’s worth keeping your hand on the pulse so you don’t miss opportunities to increase the reach of your campaign.
Other trend research tools
.
Working in an industry that relies on seasonality, it is worthwhile to study trends on a yearly basis. This allows you to plan promotional and optimization activities on your website and online store in advance. What other tools besides Google Trends are useful when analyzing seasonality?
Keyword planner
.
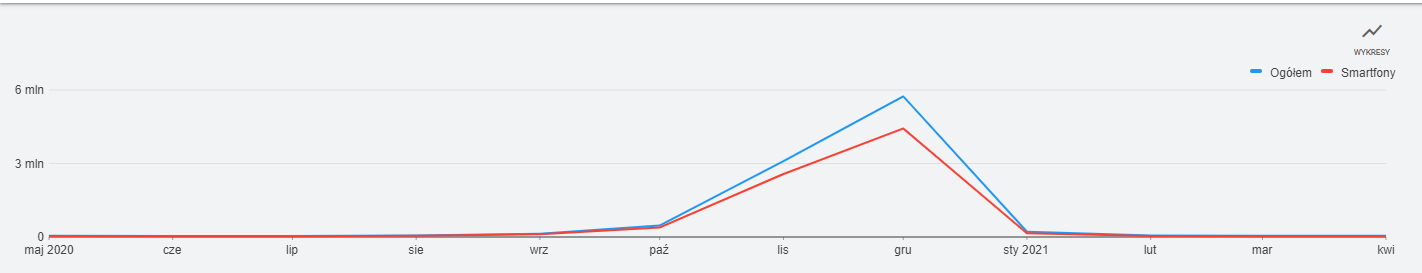
Keyword planner is a tool that supports searching for phrases for Google Ads campaigns. It is also often used by SEO specialists during keyword analysis. When we type the phrase we are interested in into the tool’s search engine, we get information,what is the average monthly number of searches for a given phrase. These are data based on the last twelve months. It’s also worth looking at a chart that shows the seasonality of a phrase. For example, the phrase “Christmas tree” has almost no searches from January to early October, while it is most popular in the period before Christmas.
 Google Trends a Google Ads.
For each phrase you check in the keyword planner, you can download detailed data in .csv or to Google Sheets about the average number of searches over the past year and by specific months.
Senuto
.
In the Visibility Analysis for a given domain, we can see what its seasonality looks like based on the keywords for which it is visible. Thanks to such data, we know when it is a time of increased traffic in a particular industry and can prepare for it accordingly.
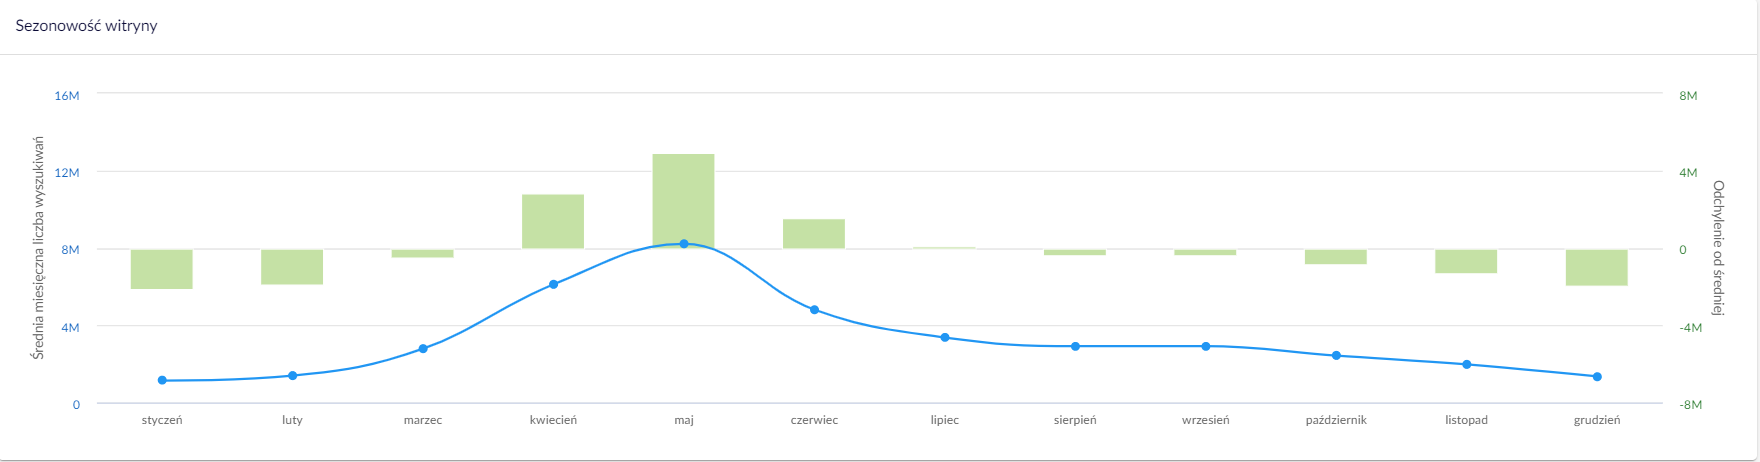 Senuto.com - Site Seasonality.
Using the example of a store offering ornamental shrubs, you can see an increase in interest from March, when their planting begins. When planning SEO activities, remember to start much earlier so that its first effects are visible in March.
Ahrefs
.
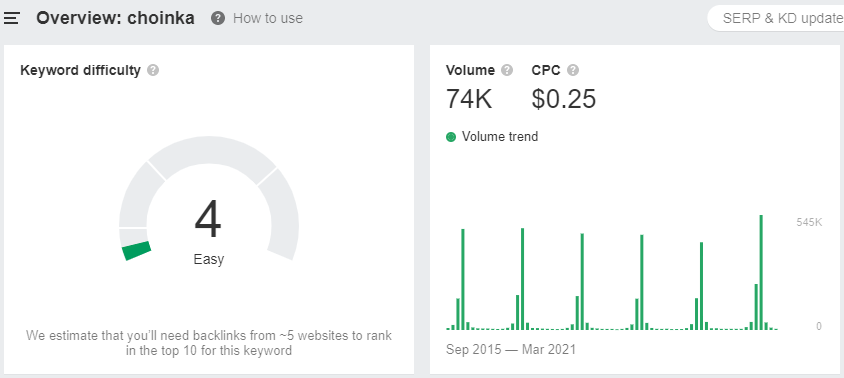
After typing a given phrase in the tool’s search engine, you will get, as in the Keyword Planner, information about its average number of searches and also a graph about its seasonality. Analyzing the phrase “Christmas tree” we see the same trend as in the Keyword Planner, confirming the interest in the topic during the Christmas season.
Why use Google Trends?
.
Google Trends, despite its few features, is an excellent addition to any marketer’s toolkit. The data provided by Google’s search engine will help us learn more about our audience and study current trends. The increase in popularity of given phrases with also their seasonality will allow us not only to respond effectively in social media, but also to plan paid Google Ads campaigns and build an SEO strategy.

Alicja Stojek
SEO Specialist w DevaGroup. Zajmuje się pozycjonowaniem i optymalizacją stron internetowych klientów. Prywatnie miłośniczka dobrych książek i jogi.
All articles →